Technical Analysis of EBAY 2024-05-10
Overview:
In analyzing the technical indicators for eBay (EBAY) over the last 5 days, we will delve into the trend, momentum, volatility, and volume indicators to provide a comprehensive outlook on the possible stock price movement in the coming days. By examining these key indicators, we aim to offer valuable insights and recommendations for potential investors.
Trend Indicators:
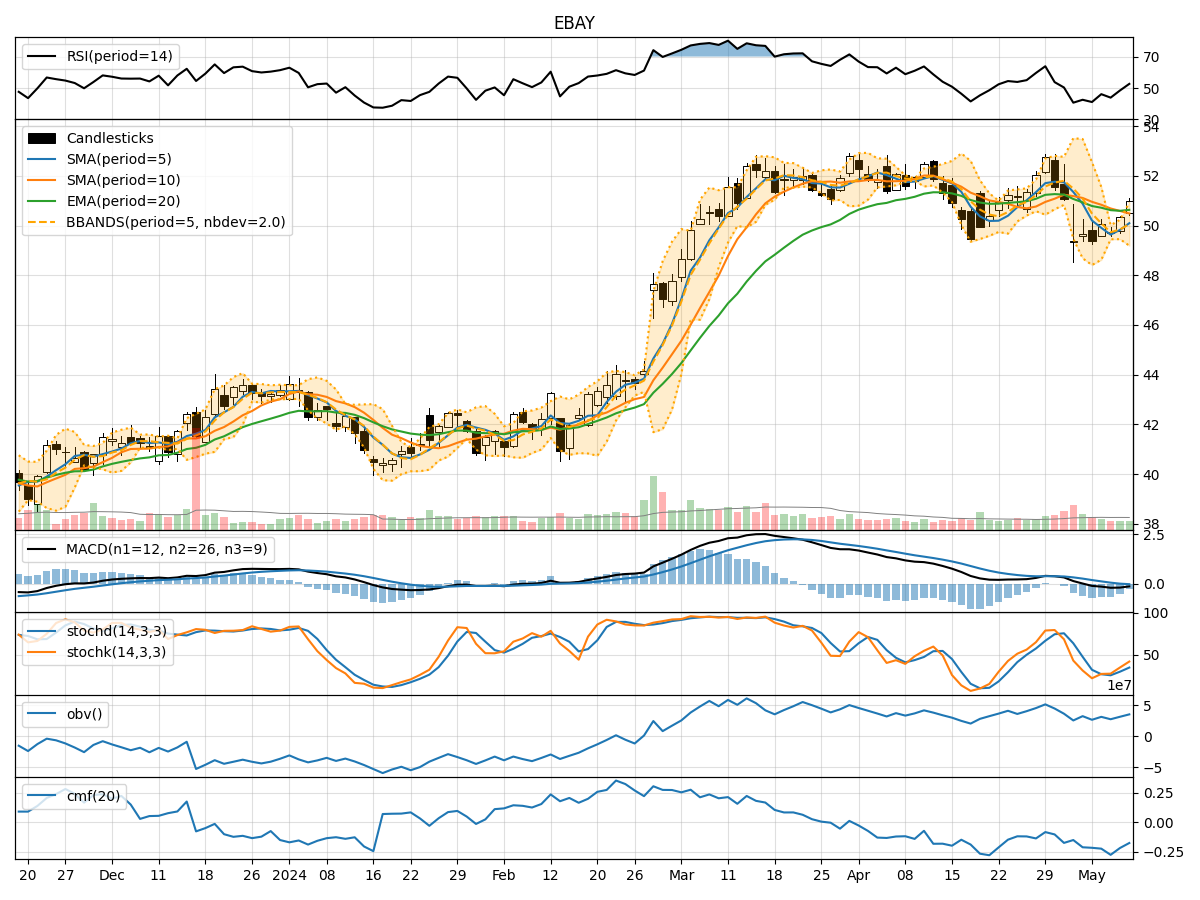
- Moving Averages (MA): The 5-day Moving Average (MA) has been fluctuating around the stock price, indicating short-term price trends. The Simple Moving Average (SMA) and Exponential Moving Average (EMA) show a slight downward trend, suggesting a bearish sentiment.
- Moving Average Convergence Divergence (MACD): The MACD and Signal Line are negative, indicating a bearish momentum in the stock price.
Momentum Indicators:
- Relative Strength Index (RSI): The RSI is below 50, indicating a bearish momentum in the stock.
- Stochastic Oscillator: Both %K and %D are below 50, suggesting a bearish sentiment.
Volatility Indicators:
- Bollinger Bands (BB): The stock price has been trading within the Bollinger Bands, indicating a period of consolidation. The bands are narrowing, suggesting a potential breakout in the near future.
Volume Indicators:
- On-Balance Volume (OBV): The OBV has been relatively stable, indicating a neutral volume flow in the stock.
- Chaikin Money Flow (CMF): The CMF is negative, suggesting a bearish money flow in the stock.
Key Observations:
- The trend indicators show a bearish sentiment with moving averages and MACD signaling a potential downward trend.
- Momentum indicators also support the bearish view with RSI and Stochastic Oscillator below key levels.
- Volatility indicators point towards a period of consolidation with potential for a breakout.
- Volume indicators indicate a neutral volume flow with a bearish money flow according to CMF.
Conclusion:
Based on the analysis of the technical indicators, the next few days' possible stock price movement for eBay (EBAY) is likely to be downward. The bearish trend and momentum, coupled with neutral volume and consolidation in volatility, suggest a potential decline in the stock price. Investors should exercise caution and consider waiting for a clearer signal before making any trading decisions.