Technical Analysis of DUET 2024-05-10
Overview:
In analyzing the technical indicators for DUET stock over the last 5 days, we will delve into the trends, momentum, volatility, and volume indicators to provide a comprehensive outlook on the possible future stock price movement. By examining key metrics such as moving averages, MACD, RSI, Bollinger Bands, and OBV, we aim to offer valuable insights and recommendations for potential trading strategies.
Trend Indicators:
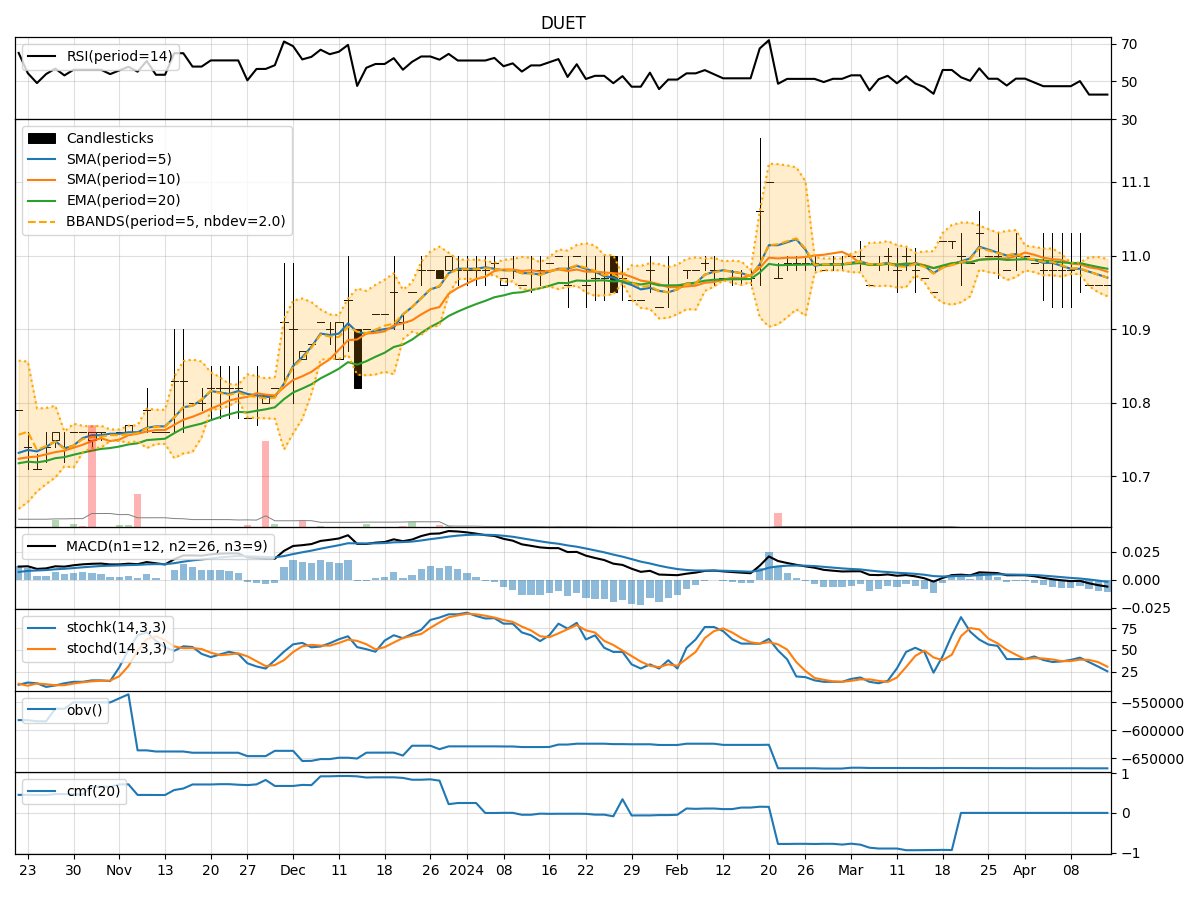
- Moving Averages (MA): The 5-day MA has been relatively stable around the closing prices, indicating a neutral trend.
- MACD: The MACD line has shown a slight positive divergence, suggesting a potential bullish momentum.
- MACD Histogram: The histogram has been gradually increasing, indicating strengthening bullish momentum.
Momentum Indicators:
- RSI: The RSI has been trending upwards, reaching the overbought territory, signaling a potential bullish sentiment.
- Stochastic Oscillator: Both %K and %D lines have been rising, indicating increasing buying pressure.
- Williams %R: The indicator has been moving towards the oversold region, suggesting a potential reversal in the short term.
Volatility Indicators:
- Bollinger Bands: The bands have been narrowing, indicating decreasing volatility and a possible consolidation phase.
- Bollinger %B: The %B indicator has been hovering around 0.7, suggesting a neutral stance.
- Bollinger Band Width: The band width has been contracting, indicating a potential breakout or significant price movement ahead.
Volume Indicators:
- On-Balance Volume (OBV): The OBV has been relatively flat, suggesting a balance between buying and selling pressure.
- Chaikin Money Flow (CMF): The CMF has been positive, indicating accumulation of the stock over the past 20 days.
Key Observations:
- The trend indicators show a potential bullish bias with the MACD and RSI signaling positive momentum.
- Volatility indicators point towards a consolidation phase with decreasing volatility.
- Volume indicators suggest a balanced accumulation of the stock without significant spikes in buying or selling pressure.
Conclusion:
Based on the analysis of the technical indicators, the next few days for DUET stock could see a continuation of the bullish trend with a potential for upward price movement. Traders may consider buying opportunities based on the positive momentum signals from the MACD and RSI. However, it is essential to monitor the price action closely for any signs of reversal or overbought conditions. Overall, the outlook for DUET stock appears bullish in the short term.