Technical Analysis of DSWL 2024-05-10
Overview:
In analyzing the technical indicators for DSWL over the last 5 days, we will delve into the trends, momentum, volatility, and volume aspects to provide a comprehensive outlook on the possible stock price movement. By examining these key indicators, we aim to offer valuable insights and predictions for the upcoming trading days.
Trend Analysis:
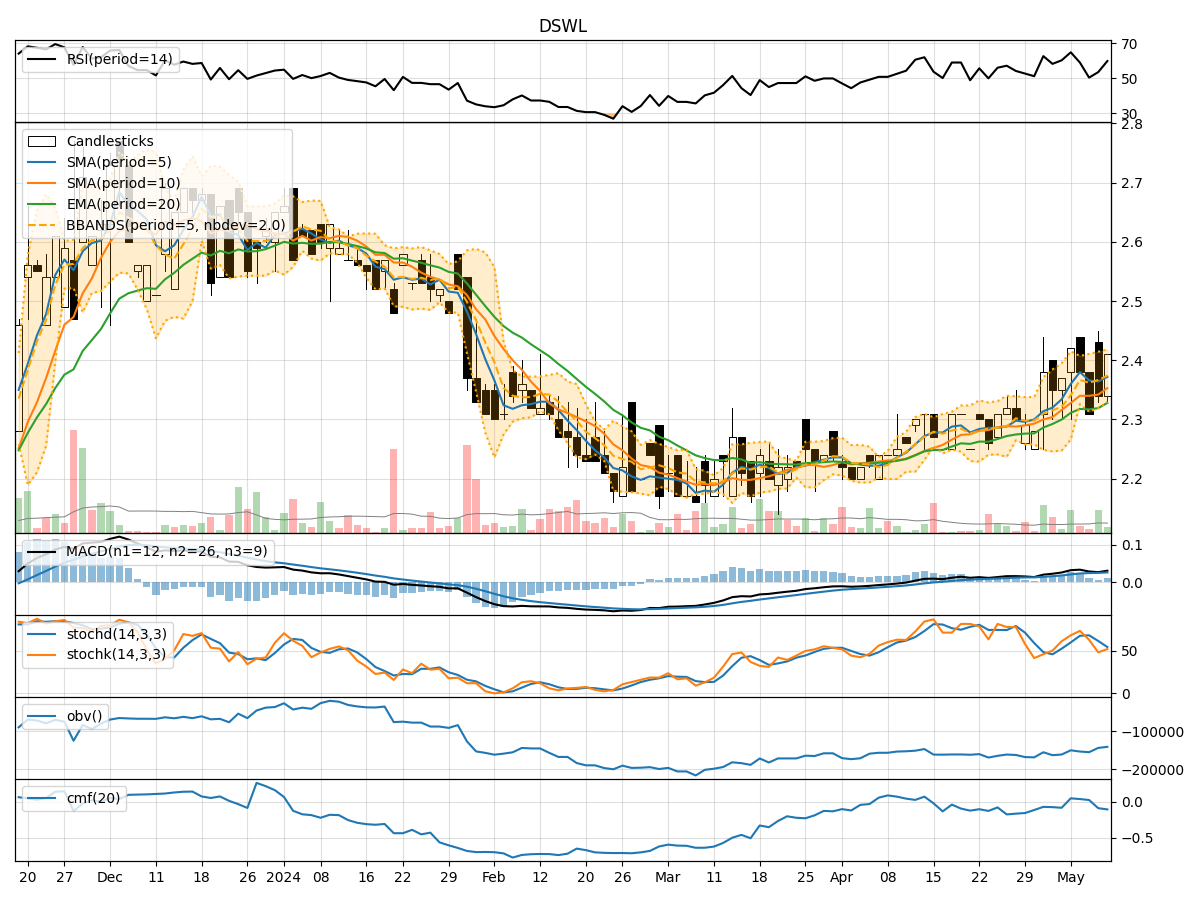
- Moving Averages (MA): The 5-day Moving Average (MA) has been fluctuating around the current price, indicating a short-term trend. The Simple Moving Average (SMA) and Exponential Moving Average (EMA) show a slight upward trend, with the EMA slightly higher than the SMA.
- MACD: The Moving Average Convergence Divergence (MACD) is positive, suggesting a bullish momentum in the stock price.
Momentum Analysis:
- RSI: The Relative Strength Index (RSI) has been oscillating within the neutral range, indicating a balanced momentum in the stock.
- Stochastic Oscillator: The Stochastic indicators show mixed signals, with the %K and %D lines crossing each other, suggesting potential indecision in the market sentiment.
Volatility Analysis:
- Bollinger Bands: The Bollinger Bands are relatively narrow, indicating low volatility in the stock price. The bands have not shown significant expansion or contraction over the past few days.
Volume Analysis:
- On-Balance Volume (OBV): The OBV has been fluctuating, indicating a balance between buying and selling pressure in the stock.
- Chaikin Money Flow (CMF): The CMF is negative, suggesting a slight outflow of money from the stock over the analyzed period.
Key Observations:
- The trend indicators suggest a neutral to slightly bullish outlook in the short term.
- Momentum indicators show mixed signals, indicating potential indecision among traders.
- Volatility remains low, reflecting a stable price movement.
- Volume indicators depict a balance between buying and selling pressure.
Conclusion:
Based on the analysis of the technical indicators, the stock price of DSWL is likely to experience sideways movement in the upcoming trading days. The trend is relatively neutral, with a slight bullish bias, while momentum and volume indicators do not provide a clear directional signal. The low volatility suggests a lack of significant price fluctuations. Traders and investors may expect the stock to consolidate within its current range without a strong bias towards either an upward or downward movement. It is advisable to closely monitor key support and resistance levels for potential breakout opportunities.