Technical Analysis of DRTS 2024-05-10
Overview:
In analyzing the technical indicators for DRTS over the last 5 days, we will delve into the trend, momentum, volatility, and volume indicators to forecast the possible stock price movement in the upcoming days. By examining these key aspects, we aim to provide a comprehensive and insightful prediction for the future direction of DRTS stock.
Trend Analysis:
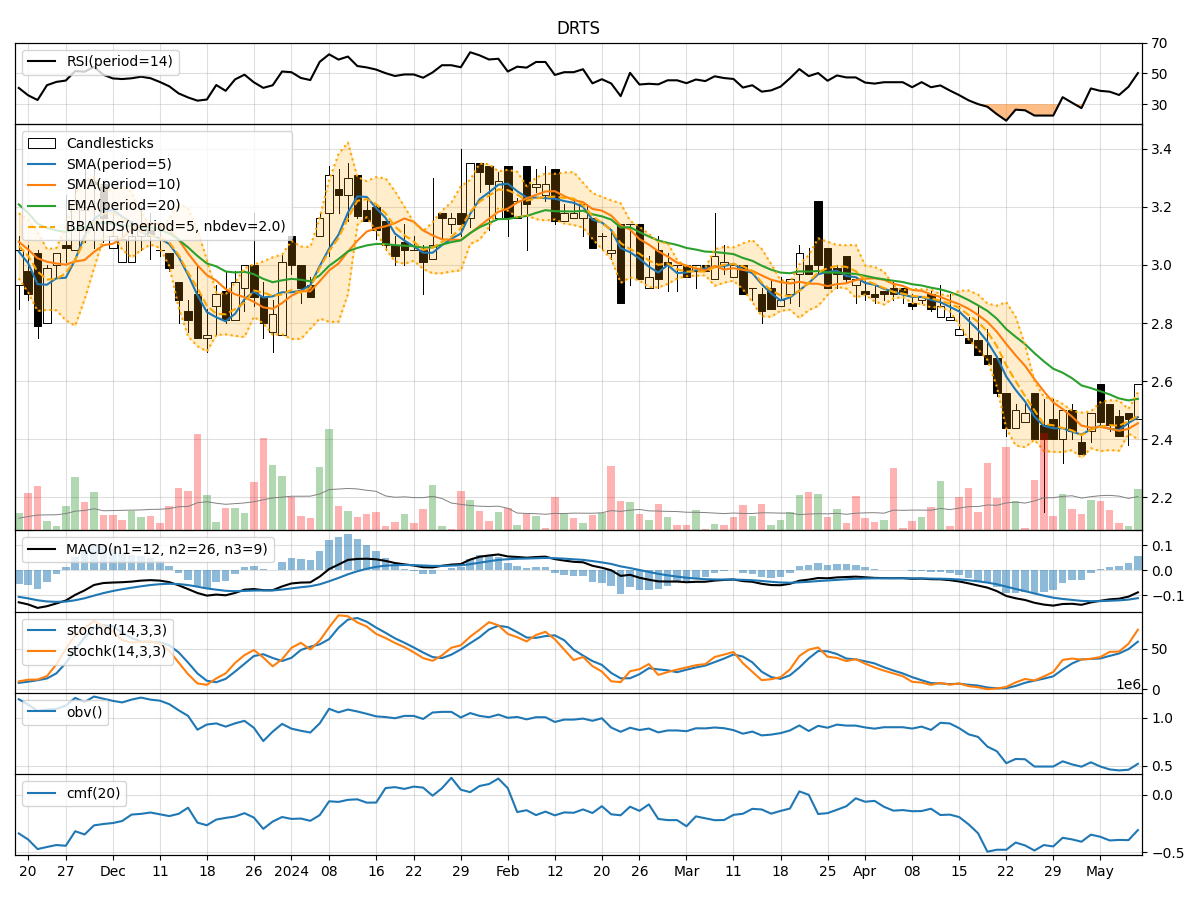
- Moving Averages (MA): The 5-day Moving Average (MA) has been fluctuating around the closing prices, indicating short-term price trends. The Simple Moving Average (SMA) and Exponential Moving Average (EMA) show a downward trend, suggesting a bearish sentiment in the short to mid-term.
- MACD: The Moving Average Convergence Divergence (MACD) and its signal line (MACDH) have been negative, indicating a bearish trend in the stock price momentum.
Momentum Analysis:
- RSI: The Relative Strength Index (RSI) has been below 50, indicating a bearish momentum in the stock.
- Stochastic Oscillator: Both %K and %D lines of the Stochastic Oscillator have been in the overbought zone, suggesting a potential reversal or correction in the stock price.
- Williams %R: The Williams %R is at 0, indicating an overbought condition and a possible upcoming price reversal.
Volatility Analysis:
- Bollinger Bands (BB): The Bollinger Bands show a widening of the bands, indicating increased volatility in the stock price.
- Bollinger %B: The %B value is close to 1, suggesting that the stock price is near the upper band, potentially signaling an overbought condition.
Volume Analysis:
- On-Balance Volume (OBV): The OBV has been declining, indicating selling pressure in the stock.
- Chaikin Money Flow (CMF): The CMF has been negative, suggesting a bearish money flow in the stock.
Conclusion:
Based on the analysis of the technical indicators, the overall outlook for DRTS in the next few days appears to be bearish. The trend indicators, momentum oscillators, volatility measures, and volume indicators collectively point towards a potential downward movement in the stock price. Traders and investors should exercise caution and consider shorting or staying on the sidelines until a clearer trend reversal signal emerges.