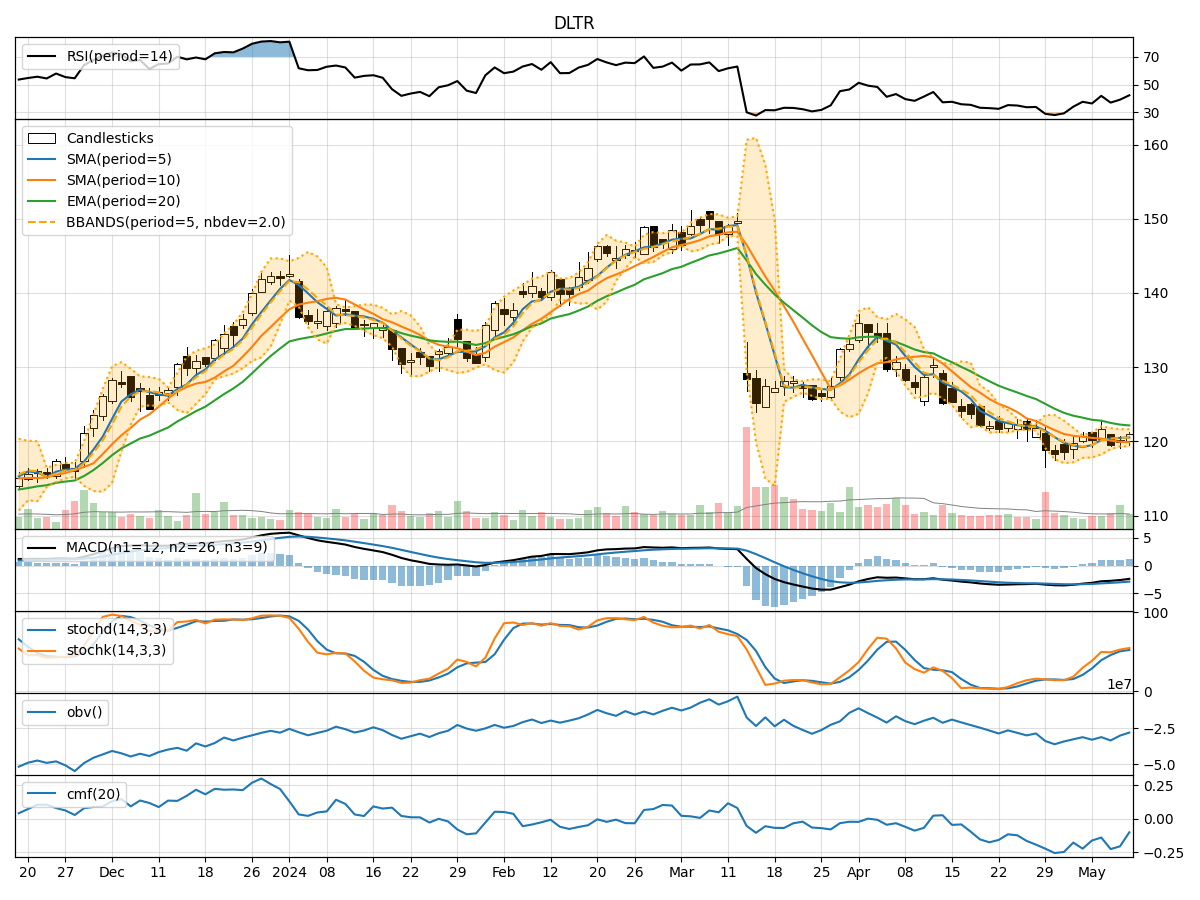
Technical Analysis of DLTR 2024-05-10
Overview:
In analyzing the technical indicators for DLTR over the last 5 days, we will delve into the trend, momentum, volatility, and volume indicators to provide a comprehensive outlook on the possible stock price movement in the coming days.
Trend Analysis:
- Moving Averages (MA): The 5-day Moving Average (MA) has been consistently above the 10-day Simple Moving Average (SMA), indicating a short-term bullish trend.
- Exponential Moving Average (EMA): The EMA(20) has been gradually declining, suggesting a weakening trend.
- Moving Average Convergence Divergence (MACD): The MACD line has been positive but decreasing, while the MACD Histogram has been showing a slight uptrend.
Momentum Analysis:
- Relative Strength Index (RSI): The RSI has been hovering around the mid-level, indicating a neutral momentum.
- Stochastic Oscillator: Both %K and %D have been in the overbought zone, suggesting a potential reversal.
- Williams %R (Willams %R): The Williams %R has been fluctuating in the oversold and overbought regions, reflecting mixed momentum.
Volatility Analysis:
- Bollinger Bands (BB): The stock price has been trading within the Bollinger Bands, with the bands narrowing, indicating decreasing volatility.
- Bollinger Band Percentage (BBP): The BBP has been fluctuating around the mid-level, signifying stable volatility.
Volume Analysis:
- On-Balance Volume (OBV): The OBV has been declining, indicating selling pressure in the stock.
- Chaikin Money Flow (CMF): The CMF has been negative, suggesting outflow of money from the stock.
Key Observations:
- The trend indicators show a mixed picture with a short-term bullish bias but a weakening EMA.
- Momentum indicators suggest a neutral to slightly bearish sentiment.
- Volatility indicators point towards decreasing volatility and a stable price range.
- Volume indicators reflect selling pressure and negative money flow.
Conclusion:
Based on the analysis of the technical indicators, the stock price of DLTR is likely to experience further downside movement in the coming days. The weakening trend, mixed momentum, decreasing volatility, and negative volume signals indicate a potential bearish outlook. Traders and investors should exercise caution and consider short-term selling strategies or wait for a clearer trend reversal signal before considering long positions.