Technical Analysis of DLO 2024-05-10
Overview:
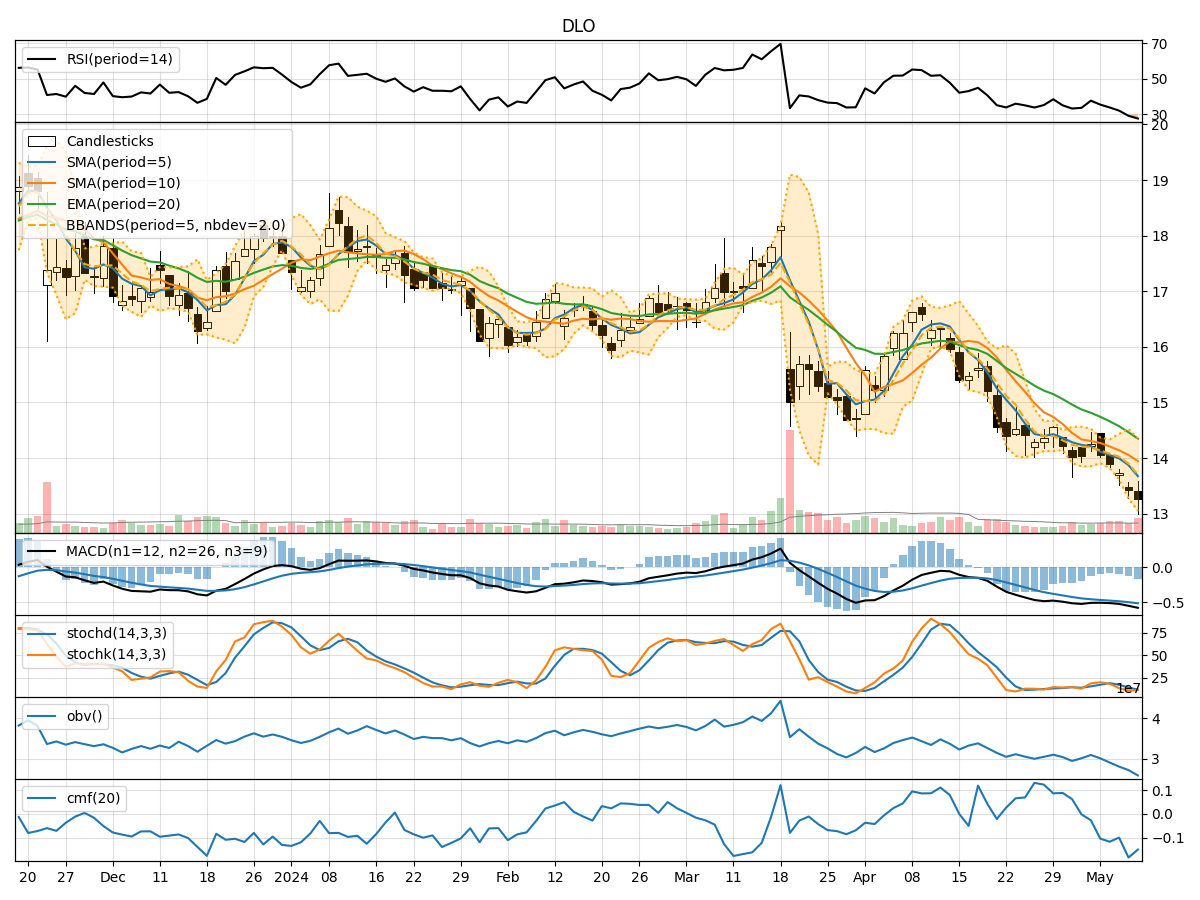
In analyzing the technical indicators for DLO stock over the last 5 days, we will delve into the trend, momentum, volatility, and volume indicators to provide a comprehensive outlook on the possible stock price movement in the coming days. By examining key metrics such as moving averages, MACD, RSI, Bollinger Bands, and OBV, we aim to offer valuable insights and recommendations for potential trading strategies.
Trend Analysis:
- Moving Averages (MA): The 5-day MA has been consistently below the closing prices, indicating a short-term downtrend.
- MACD: The MACD line has been decreasing, with the MACD histogram showing negative values, suggesting a bearish momentum.
- EMA: The EMA(20) is above the current price, indicating a bearish trend.
Momentum Analysis:
- RSI: The RSI has been declining and is below 30, signaling an oversold condition.
- Stochastic Oscillator: Both %K and %D are in the oversold territory, indicating a potential reversal.
- Williams %R: The indicator is in the oversold region, suggesting a possible buying opportunity.
Volatility Analysis:
- Bollinger Bands: The price has been consistently below the lower Bollinger Band, indicating oversold conditions.
- Bollinger %B: The %B is below 0.2, suggesting a potential bounce back.
- Bollinger Band Width: The band width has been widening, indicating increased volatility.
Volume Analysis:
- On-Balance Volume (OBV): The OBV has been declining, indicating selling pressure.
- Chaikin Money Flow (CMF): The CMF is negative, suggesting a lack of buying interest.
Key Observations and Opinions:
- Trend: The trend indicators point towards a downward trajectory.
- Momentum: Momentum indicators suggest an oversold condition with a potential for a reversal.
- Volatility: Volatility indicators show increased volatility with the potential for a bounce back.
- Volume: Volume indicators indicate selling pressure and a lack of buying interest.
Conclusion:
Based on the analysis of the technical indicators, the next few days for DLO stock are likely to see a potential reversal in momentum due to oversold conditions. However, the overall trend remains bearish, supported by selling pressure and lack of buying interest. Traders should exercise caution and wait for confirmation signals before considering any long positions. Short-term traders may find opportunities for quick gains during potential bounces, but the overall outlook remains bearish until a clear trend reversal is confirmed.