Technical Analysis of DDI 2024-05-10
Overview:
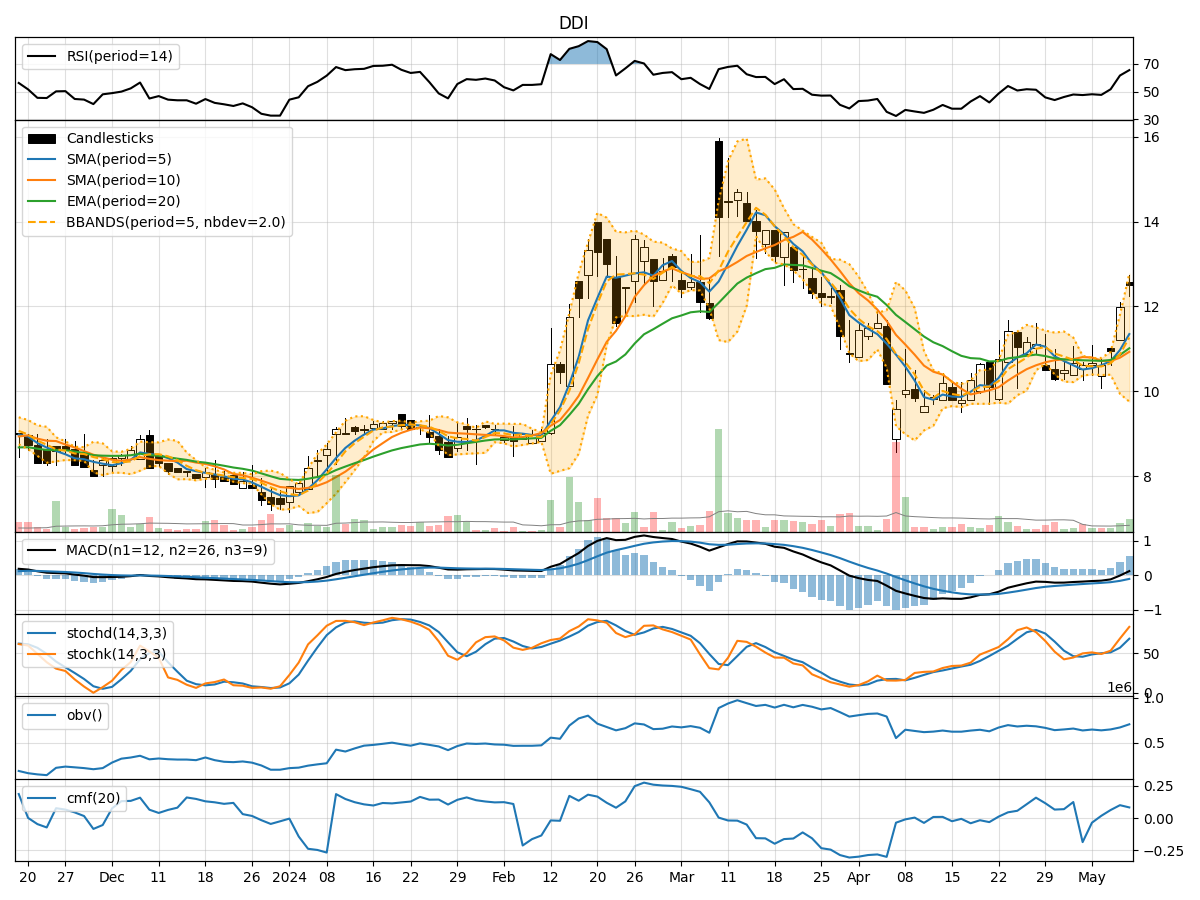
In analyzing the technical indicators for DDI stock over the last 5 days, we will delve into the trend, momentum, volatility, and volume indicators to provide a comprehensive outlook on the possible stock price movement in the coming days.
Trend Indicators:
- Moving Averages (MA): The 5-day Moving Average (MA) has been showing an upward trend, indicating a positive momentum in the stock price.
- MACD: The Moving Average Convergence Divergence (MACD) has been consistently increasing, suggesting a strengthening bullish momentum.
- EMA: The Exponential Moving Average (EMA) has been on an upward trajectory, supporting the bullish sentiment in the stock.
Momentum Indicators:
- RSI: The Relative Strength Index (RSI) has been trending upwards, indicating increasing buying pressure and potential for further price appreciation.
- Stochastic Oscillator: Both %K and %D of the Stochastic Oscillator are in the overbought zone, signaling a strong bullish momentum.
- Williams %R: The Williams %R is in the oversold territory, suggesting a potential reversal to the upside.
Volatility Indicators:
- Bollinger Bands: The Bollinger Bands are widening, indicating increased volatility in the stock price.
- Bollinger %B: The %B indicator is below 1, suggesting that the stock price is trading below the upper Bollinger Band, potentially indicating a buying opportunity.
- Bollinger Band Width: The Band Width is expanding, indicating a potential increase in price volatility.
Volume Indicators:
- On-Balance Volume (OBV): The OBV has been steadily increasing, reflecting strong buying volume in the stock.
- Chaikin Money Flow (CMF): The CMF is positive, indicating that money is flowing into the stock, supporting the bullish outlook.
Key Observations and Opinions:
- Trend: The stock is in a strong uptrend based on the moving averages and MACD, suggesting a continuation of the bullish momentum.
- Momentum: Momentum indicators like RSI and Stochastic Oscillator are in overbought territory, indicating a potential pullback or consolidation in the short term.
- Volatility: Increasing volatility as indicated by Bollinger Bands widening could lead to larger price swings in the coming days.
- Volume: Strong buying volume as seen in OBV supports the current uptrend in the stock.
Conclusion:
Based on the analysis of the technical indicators, the next few days' possible stock price movement for DDI is likely to experience a short-term pullback or consolidation due to overbought conditions in momentum indicators. However, the overall trend remains bullish, supported by strong buying volume and positive trend indicators. Traders may consider buying on dips as the stock is expected to resume its upward trajectory after a brief consolidation phase.