Technical Analysis of DCTH 2024-05-31
Overview:
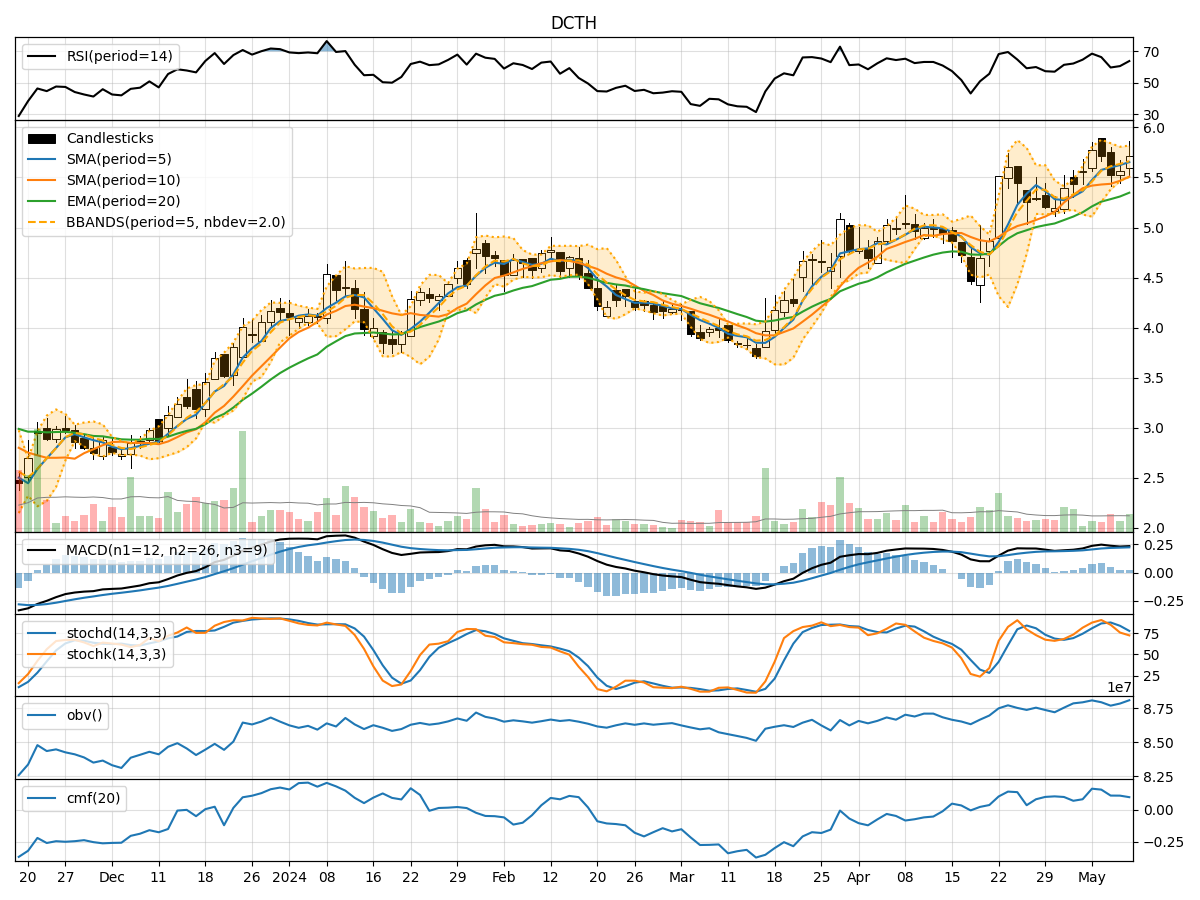
In analyzing the technical indicators for DCTH over the last 5 days, we will delve into the trends, momentum, volatility, and volume indicators to provide a comprehensive outlook on the possible stock price movement. By examining these key aspects, we aim to offer valuable insights and predictions for the upcoming days.
Trend Indicators:
- Moving Averages (MA): The 5-day moving average has been consistently below the closing price, indicating a short-term downtrend.
- MACD: The MACD line has been positive, but the MACD histogram has shown a decreasing trend, suggesting a potential reversal in momentum.
- EMA: The exponential moving average has been gradually increasing, reflecting a bullish sentiment in the longer term.
Momentum Indicators:
- RSI: The Relative Strength Index has been fluctuating but remains in the neutral zone, indicating a balanced momentum.
- Stochastic Oscillator: Both %K and %D have been declining, signaling a potential bearish momentum.
- Williams %R: The indicator has been moving towards oversold territory, suggesting a possible reversal in the short term.
Volatility Indicators:
- Bollinger Bands: The bands have been narrowing, indicating decreasing volatility and a potential consolidation phase.
- Bollinger %B: The %B indicator has been fluctuating around the midline, reflecting a lack of clear direction in price movement.
Volume Indicators:
- On-Balance Volume (OBV): The OBV has shown mixed signals, with no clear trend in volume accumulation or distribution.
- Chaikin Money Flow (CMF): The CMF has been relatively stable but on the positive side, indicating some buying pressure.
Key Observations and Opinions:
- Trend: The short-term trend is bearish, while the longer-term trend remains slightly bullish.
- Momentum: Momentum is currently neutral to bearish, with signs of a potential reversal in the short term.
- Volatility: Volatility is decreasing, suggesting a period of consolidation or sideways movement.
- Volume: Volume indicators are inconclusive, reflecting uncertainty in market participation.
Conclusion:
Based on the analysis of the technical indicators, the next few days for DCTH are likely to see sideways movement with a slight bearish bias. Traders should exercise caution and wait for clearer signals before taking significant positions. The stock may experience some consolidation before a potential directional move. It is advisable to closely monitor key support and resistance levels for better decision-making.
Disclaimer:
This analysis is based solely on technical indicators and historical data. Market conditions can change rapidly, and unforeseen events may impact stock prices. It is essential to consider other factors and conduct thorough research before making any investment decisions. Consulting with a financial advisor is recommended for personalized guidance tailored to individual investment goals and risk tolerance levels.