Technical Analysis of DADA 2024-05-10
Overview:
In analyzing the technical indicators for DADA stock over the last 5 days, we will delve into the trends, momentum, volatility, and volume indicators to provide a comprehensive outlook on the possible future stock price movement. By examining these key indicators, we aim to offer valuable insights and recommendations for potential investors.
Trend Analysis:
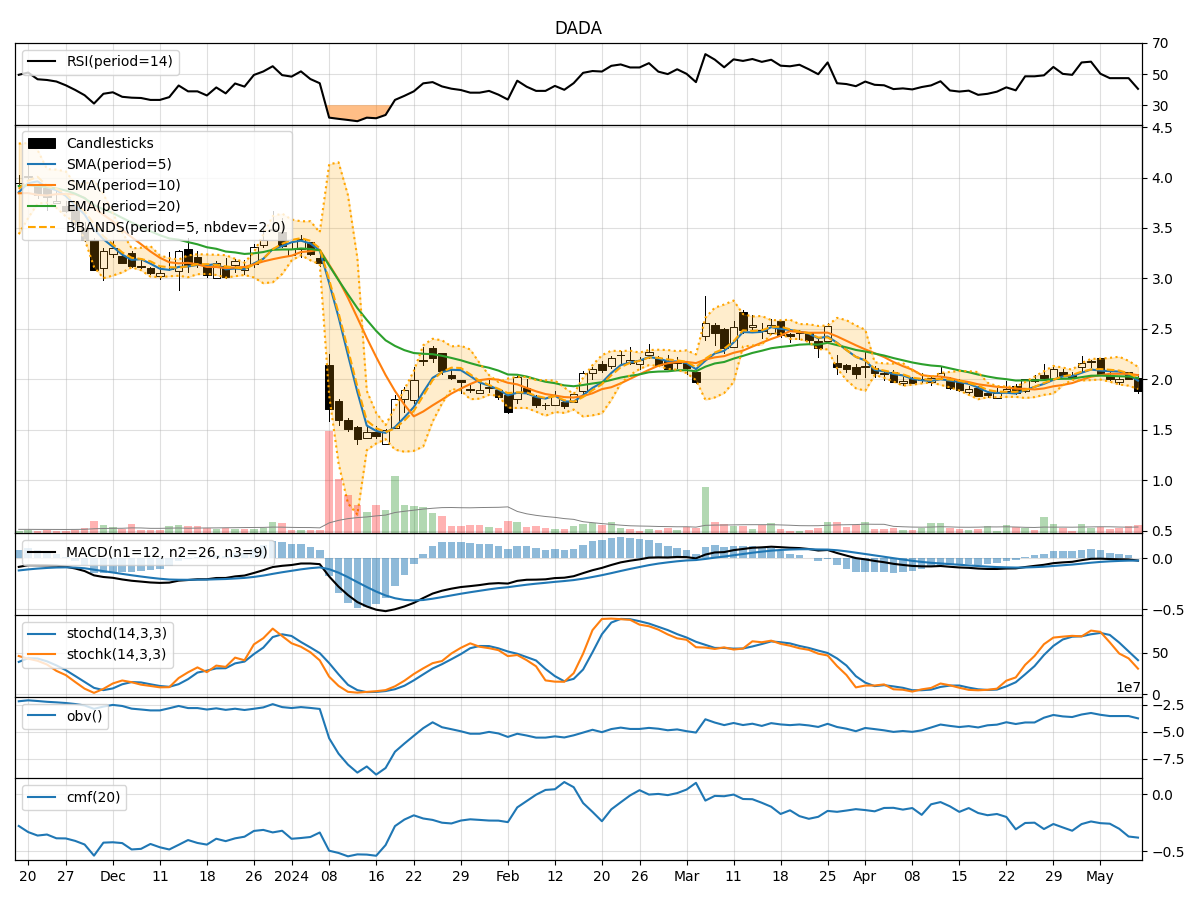
- Moving Averages (MA): The 5-day Moving Average (MA) has been declining steadily, indicating a bearish trend in the short term.
- MACD and Signal Line: The MACD line has been consistently below the Signal Line, suggesting a bearish momentum in the stock price.
- Relative Strength Index (RSI): The RSI has been decreasing, indicating a weakening momentum in the stock.
Momentum Analysis:
- Stochastic Oscillator: Both %K and %D have been decreasing, signaling a bearish momentum in the stock price.
- Williams %R (WillR): The Williams %R is in oversold territory, indicating a potential reversal or bounce in the stock price.
Volatility Analysis:
- Bollinger Bands (BB): The stock price has been trading below the lower Bollinger Band, indicating oversold conditions and a potential reversal.
- Bollinger Band Width (BBW): The Bollinger Band Width has been narrowing, suggesting a decrease in volatility.
Volume Analysis:
- On-Balance Volume (OBV): The OBV has been declining, indicating selling pressure in the stock.
- Chaikin Money Flow (CMF): The CMF has been negative, suggesting outflow of money from the stock.
Conclusion:
Based on the analysis of the technical indicators, the stock is currently in a bearish phase with downward momentum. The declining moving averages, bearish MACD, decreasing RSI, and negative OBV and CMF all point towards a downward trend in the stock price in the near term. However, the oversold conditions indicated by Williams %R and the stock trading below the lower Bollinger Band may suggest a potential reversal or bounce in the stock price in the coming days.
Recommendation:
Investors should exercise caution and closely monitor the stock price movement. It is advisable to wait for confirmation of a reversal pattern or a bullish signal before considering any long positions. Short-term traders may find opportunities to capitalize on potential bounces from oversold levels, but the overall trend remains bearish until there is a significant shift in the technical indicators towards bullish territory.