Technical Analysis of CYBR 2024-05-10
Overview:
In analyzing the technical indicators for CYBR over the last 5 days, we will delve into the trend, momentum, volatility, and volume indicators to provide a comprehensive outlook on the possible stock price movement. By examining these key indicators, we aim to offer valuable insights and predictions for the upcoming days.
Trend Indicators:
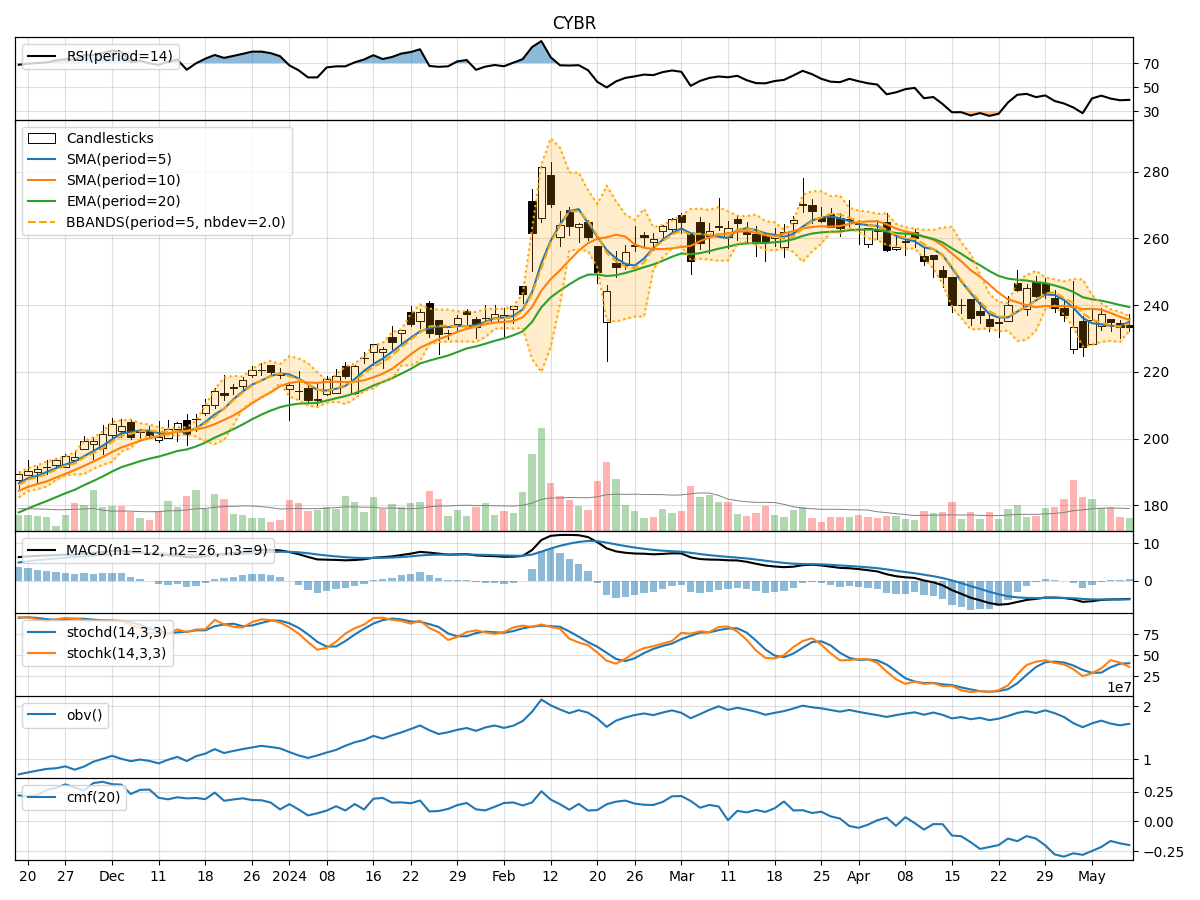
- Moving Averages (MA): The 5-day MA has been fluctuating around the closing prices, indicating short-term price trends. The Simple Moving Average (SMA) and Exponential Moving Average (EMA) show a downward trend, suggesting a bearish sentiment.
- Moving Average Convergence Divergence (MACD): The MACD line has been consistently below the signal line, indicating a bearish trend in the stock price.
- Conclusion: The trend indicators point towards a bearish outlook for CYBR in the near future.
Momentum Indicators:
- Relative Strength Index (RSI): The RSI values have been below 50, indicating a bearish momentum in the stock.
- Stochastic Oscillator: Both %K and %D values have been trending downwards, suggesting a weakening momentum.
- Conclusion: Momentum indicators support a bearish sentiment for CYBR in the upcoming days.
Volatility Indicators:
- Bollinger Bands (BB): The bands have been narrowing, indicating decreasing volatility in the stock price.
- Conclusion: Volatility indicators suggest a sideways or consolidation phase for CYBR in the near future.
Volume Indicators:
- On-Balance Volume (OBV): The OBV values have been fluctuating, indicating indecision among investors.
- Chaikin Money Flow (CMF): The CMF values have been negative, suggesting a bearish money flow.
- Conclusion: Volume indicators reflect a bearish sentiment in the market for CYBR.
Overall Conclusion:
Based on the analysis of trend, momentum, volatility, and volume indicators, the overall outlook for CYBR in the next few days is bearish. The trend indicators, momentum indicators, and volume indicators all point towards a downward movement in the stock price. While volatility indicators suggest a possible consolidation phase, the overall sentiment remains negative.
Recommendation:
Considering the bearish signals across multiple technical indicators, it is advisable to exercise caution when trading CYBR in the upcoming days. Investors may consider implementing risk management strategies and closely monitoring the price action for potential entry or exit points. It is crucial to stay informed about any market developments that could impact CYBR's price movement.