Technical Analysis of CSX 2024-05-10
Overview:
In analyzing the technical indicators for CSX over the last 5 days, we will delve into the trend, momentum, volatility, and volume indicators to provide a comprehensive outlook on the possible stock price movement. By examining these key aspects, we aim to offer valuable insights and predictions for the upcoming days.
Trend Indicators:
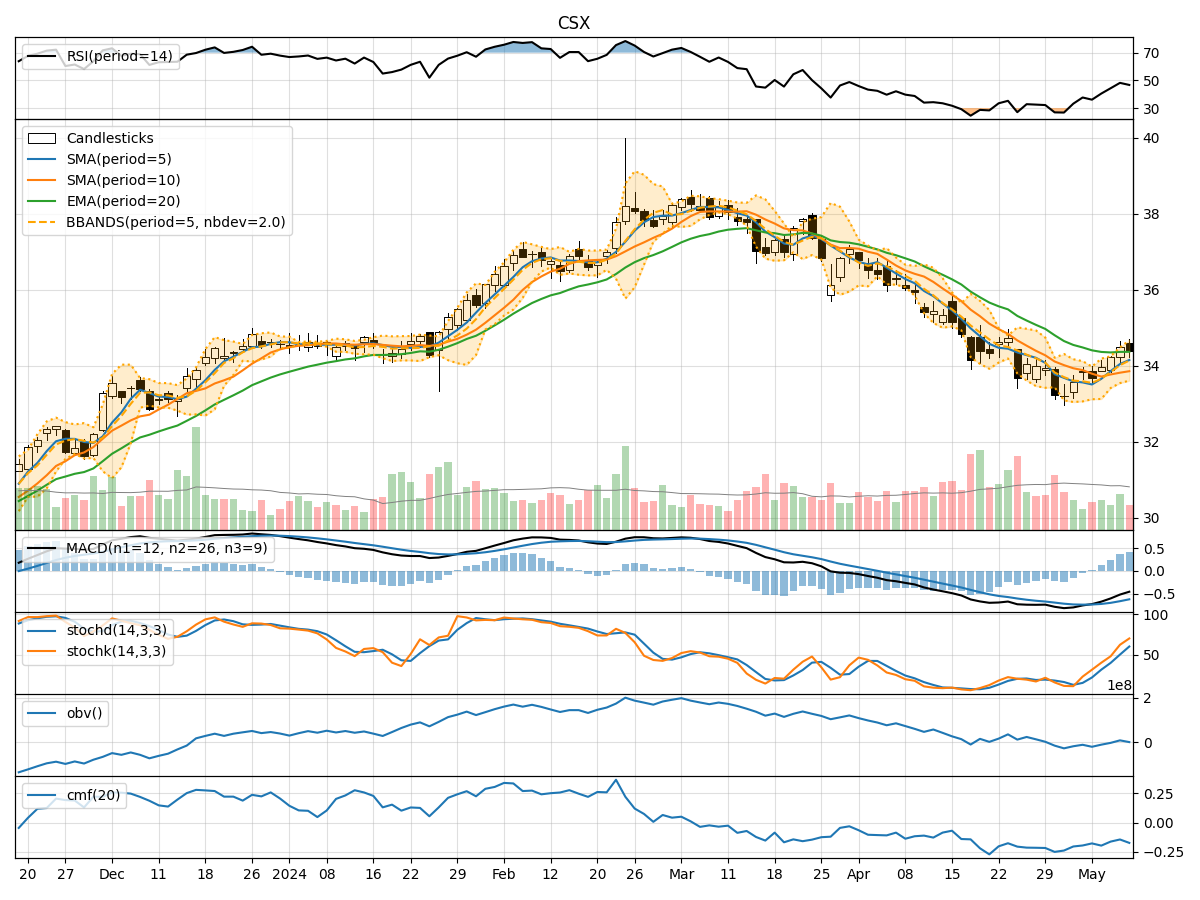
- Moving Averages (MA): The 5-day Moving Average (MA) has been showing an upward trend, indicating a positive momentum in the stock price.
- MACD: The Moving Average Convergence Divergence (MACD) has been consistently positive, suggesting bullish momentum in the stock.
- EMA: The Exponential Moving Average (EMA) has been relatively stable, reflecting a steady growth pattern in the stock price.
Momentum Indicators:
- RSI: The Relative Strength Index (RSI) has been gradually increasing, signaling a strengthening momentum in the stock.
- Stochastic Oscillator: Both %K and %D values have been rising, indicating an uptrend in the stock price momentum.
- Williams %R: The Williams %R indicator has been fluctuating but remains in the oversold territory, suggesting a potential reversal in the stock price.
Volatility Indicators:
- Bollinger Bands: The Bollinger Bands have been widening, indicating increased volatility in the stock price.
- Bollinger %B: The %B value has been fluctuating within a range, suggesting potential price reversals or breakouts.
- Average True Range (ATR): The ATR has been relatively stable, indicating consistent volatility levels in the stock.
Volume Indicators:
- On-Balance Volume (OBV): The OBV has been fluctuating, indicating mixed buying and selling pressure in the stock.
- Chaikin Money Flow (CMF): The CMF has been negative, suggesting a lack of strong buying pressure in the stock.
Key Observations and Opinions:
- Trend: The stock is currently in an upward trend based on the moving averages and MACD.
- Momentum: Momentum indicators like RSI and Stochastic Oscillator suggest bullish momentum in the stock.
- Volatility: The widening Bollinger Bands indicate increased volatility in the stock price.
- Volume: The OBV and CMF reflect mixed sentiment in terms of buying pressure.
Conclusion:
Based on the analysis of the technical indicators, the next few days for CSX stock are likely to see further upward movement. The bullish trend, positive momentum, and increased volatility suggest potential price appreciation in the near term. However, investors should closely monitor key support and resistance levels to navigate any potential market fluctuations.