Technical Analysis of CSTE 2024-05-10
Overview:
In analyzing the technical indicators for CSTE over the last 5 days, we will delve into the trend, momentum, volatility, and volume indicators to provide a comprehensive outlook on the possible stock price movement. By examining these key aspects, we aim to offer valuable insights and predictions for the upcoming days.
Trend Analysis:
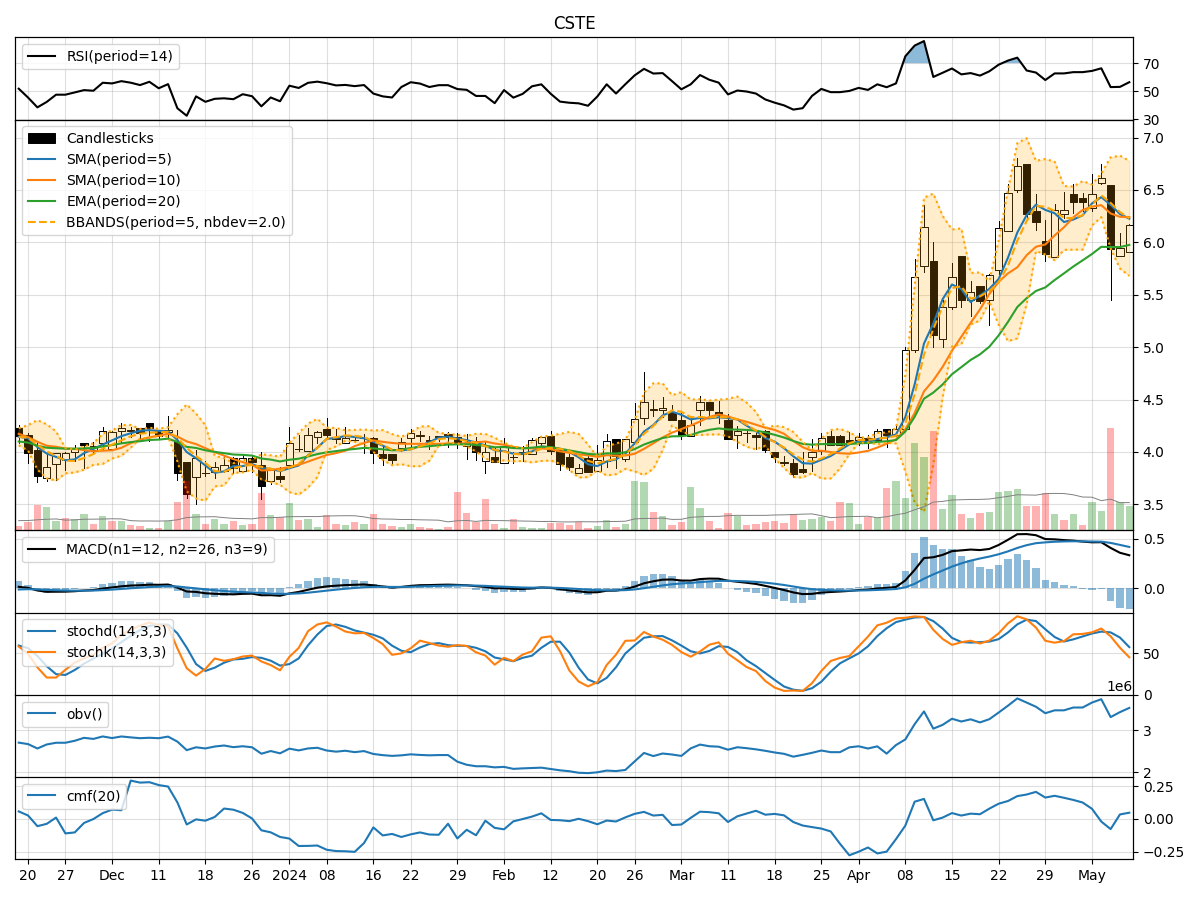
- Moving Averages (MA): The 5-day Moving Average (MA) has been fluctuating around the closing prices, indicating short-term price trends. The Simple Moving Average (SMA) and Exponential Moving Average (EMA) show a slight uptrend, suggesting potential bullish momentum.
- MACD: The Moving Average Convergence Divergence (MACD) has been positive but decreasing, signaling a potential slowdown in bullish momentum.
Momentum Analysis:
- RSI: The Relative Strength Index (RSI) has been in the neutral zone, indicating neither overbought nor oversold conditions.
- Stochastic Oscillator: Both %K and %D have been declining, suggesting a weakening bullish momentum.
- Williams %R: The Williams %R is in the oversold territory, indicating a potential buying opportunity.
Volatility Analysis:
- Bollinger Bands (BB): The Bollinger Bands have been narrowing, indicating decreasing volatility and a possible consolidation phase.
Volume Analysis:
- On-Balance Volume (OBV): The OBV has been fluctuating, suggesting mixed sentiment among investors.
- Chaikin Money Flow (CMF): The CMF has been slightly positive, indicating some buying pressure.
Key Observations:
- The trend indicators show a potential bullish bias in the short term.
- Momentum indicators suggest a weakening bullish momentum.
- Volatility is decreasing, indicating a possible consolidation phase.
- Volume indicators reflect mixed sentiment among investors.
Conclusion:
Based on the analysis of the technical indicators, the next few days for CSTE could see sideways movement with a slight upward bias. Investors should closely monitor the trend indicators for any potential reversal signals and keep an eye on the momentum indicators for confirmation of the price direction. Additionally, the decreasing volatility suggests a period of consolidation, while the volume indicators indicate mixed sentiment in the market. Overall, a cautious approach with a focus on key support and resistance levels is recommended for trading or investment decisions in the coming days.