Technical Analysis of CSIQ 2024-05-10
Overview:
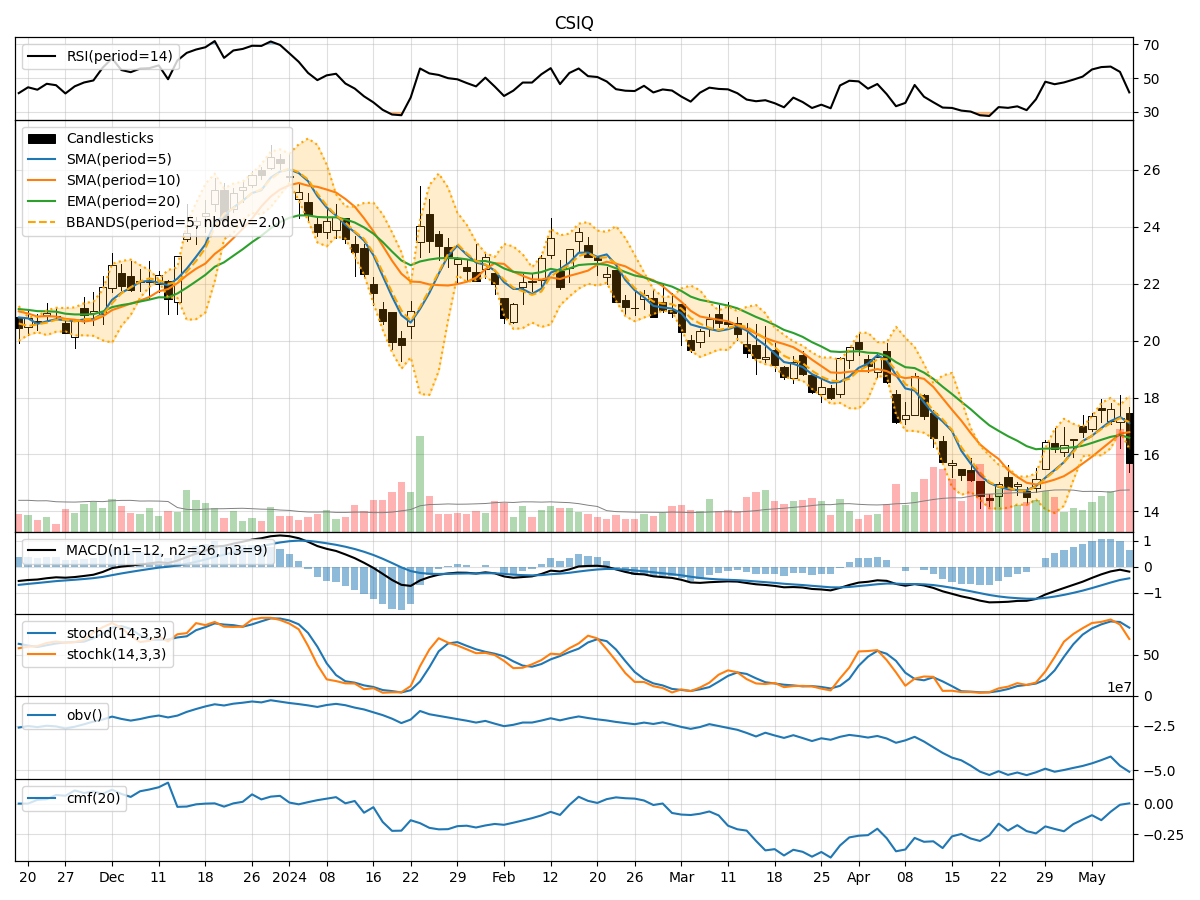
In analyzing the technical indicators for CSIQ over the last 5 days, we will delve into the trend, momentum, volatility, and volume indicators to provide a comprehensive outlook on the possible stock price movement in the coming days.
Trend Analysis:
- Moving Averages (MA): The 5-day MA has been consistently above the closing prices, indicating a bullish trend.
- MACD: The MACD line has been negative but converging towards the signal line, suggesting a potential reversal in the bearish momentum.
- RSI: The RSI has been fluctuating around the neutral zone, indicating indecision in the market sentiment.
Momentum Analysis:
- Stochastic Oscillator: The stochastic indicators have been relatively high, signaling overbought conditions in the market.
- Williams %R: The Williams %R is deeply in the oversold territory, suggesting a potential reversal in the downtrend.
Volatility Analysis:
- Bollinger Bands (BB): The stock price has been trading within the lower Bollinger Band, indicating oversold conditions.
- Volatility: The volatility has been decreasing, suggesting a potential stabilization in price movements.
Volume Analysis:
- On-Balance Volume (OBV): The OBV has been consistently negative, indicating selling pressure in the market.
- Chaikin Money Flow (CMF): The CMF has been negative, reflecting a lack of buying interest in the stock.
Key Observations:
- The stock is currently in a consolidation phase with mixed signals from different indicators.
- The momentum indicators suggest a possible reversal in the downtrend.
- The volatility is decreasing, indicating a potential stabilization in price movements.
- The volume indicators reflect selling pressure and a lack of buying interest in the stock.
Conclusion:
Based on the analysis of the technical indicators, the next few days' possible stock price movement for CSIQ is likely to be sideways with a slight upward bias. Traders should exercise caution and wait for clearer signals before making significant trading decisions. It is advisable to monitor the trend indicators closely for any signs of a confirmed trend reversal before considering long positions.