Technical Analysis of CRTO 2024-05-10
Overview:
In analyzing the technical indicators for CRTO over the last 5 days, we will delve into the trend, momentum, volatility, and volume indicators to provide a comprehensive outlook on the possible stock price movement. By examining these key aspects, we aim to offer valuable insights and predictions for the upcoming days.
Trend Analysis:
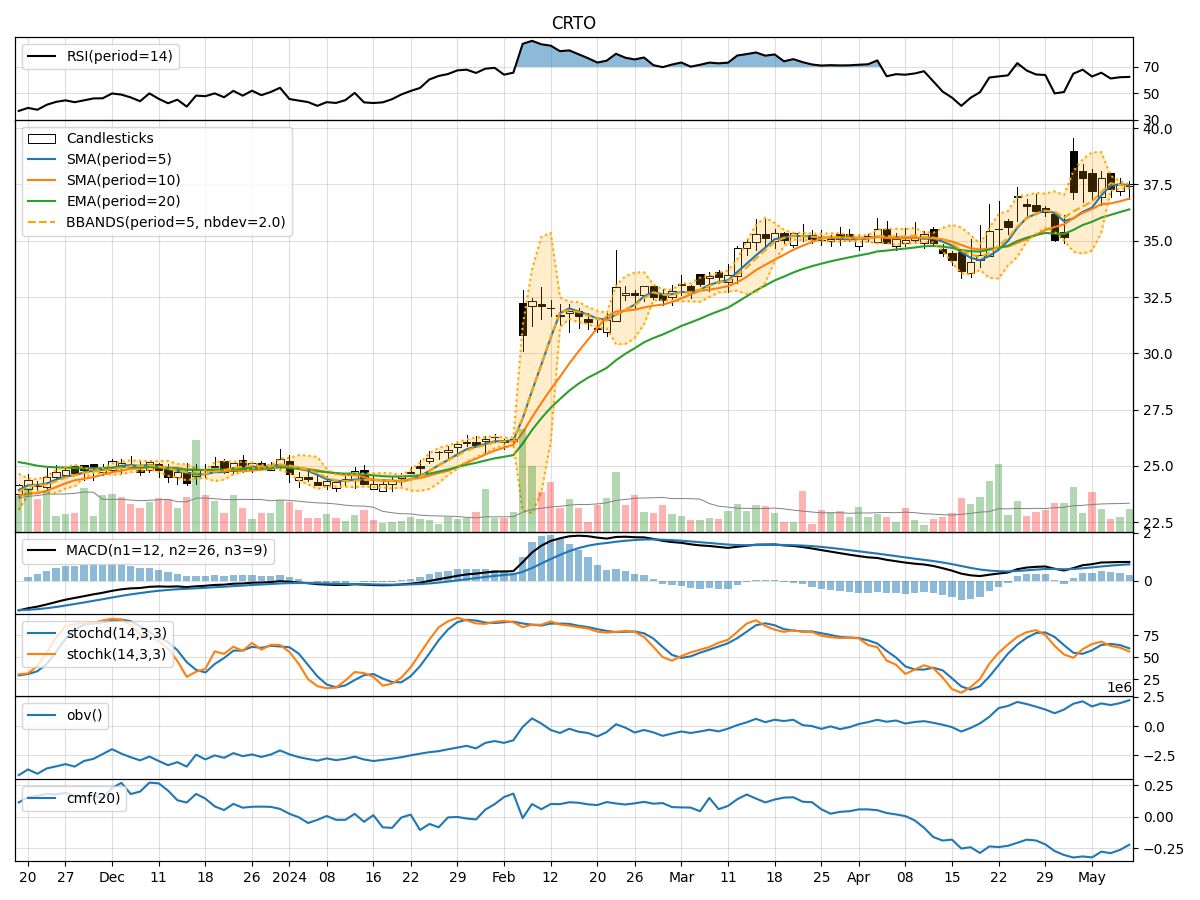
- Moving Averages (MA): The 5-day MA has been consistently above the closing prices, indicating a bullish trend.
- MACD: The MACD line has been above the signal line, suggesting a positive momentum in the stock price.
Key Observation: The trend indicators point towards a bullish sentiment in the stock price movement.
Momentum Analysis:
- RSI: The RSI values have been in the range of 60-65, indicating a moderate level of buying pressure.
- Stochastic Oscillator: Both %K and %D values have been declining, signaling a potential reversal in momentum.
Key Observation: Momentum indicators suggest a neutral to slightly bearish outlook for the stock.
Volatility Analysis:
- Bollinger Bands (BB): The stock price has been trading within the bands, with the %B indicator hovering around 0.5.
Key Observation: Volatility remains stable with no significant deviations in the stock price.
Volume Analysis:
- On-Balance Volume (OBV): The OBV values have been fluctuating, indicating mixed buying and selling pressure.
- Chaikin Money Flow (CMF): The CMF values have been negative, suggesting a net outflow of money from the stock.
Key Observation: Volume indicators reflect mixed sentiment with no clear direction in buying or selling pressure.
Conclusion:
Based on the analysis of the technical indicators, the overall outlook for CRTO in the next few days is as follows: - Trend: Upward trend based on moving averages and MACD. - Momentum: Neutral to slightly bearish momentum based on RSI and Stochastic Oscillator. - Volatility: Stable volatility within Bollinger Bands. - Volume: Mixed sentiment with no clear direction in buying or selling pressure.
Final Verdict:
Considering the bullish trend indicators and stable volatility, there is a possibility of upward movement in the stock price in the next few days. However, the neutral to slightly bearish momentum and mixed volume signals suggest a cautious approach. Traders and investors should closely monitor key levels and wait for confirmation before making any significant trading decisions.
Disclaimer:
This analysis is based on historical data and technical indicators, and it is important to consider other fundamental factors and market dynamics before making investment decisions. Consult with a financial advisor for personalized advice tailored to your specific financial goals and risk tolerance.