Technical Analysis of CRON 2024-05-10
Overview:
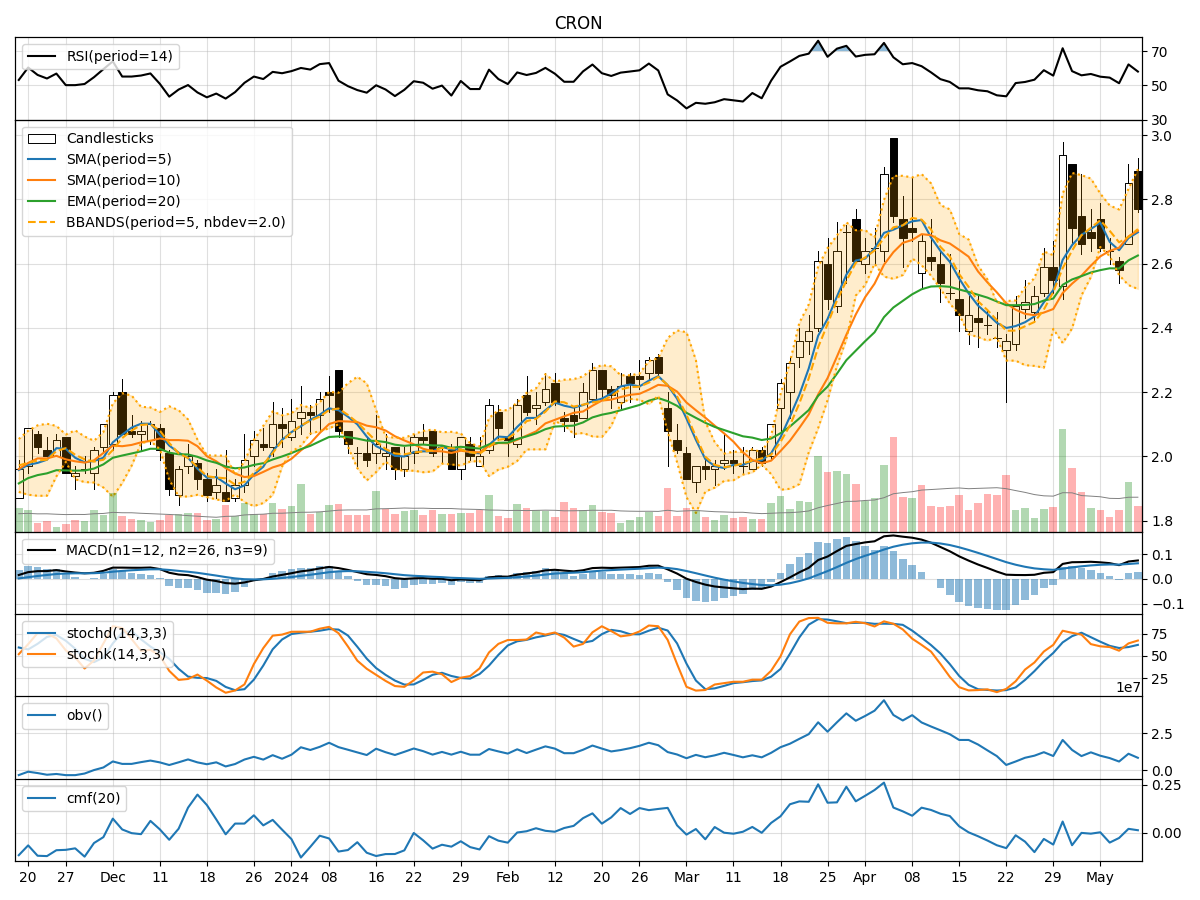
In analyzing the technical indicators for CRON over the last 5 days, we will delve into the trend, momentum, volatility, and volume indicators to provide a comprehensive outlook on the possible stock price movement. By examining these key aspects, we aim to offer valuable insights and predictions for the upcoming days.
Trend Indicators:
- Moving Averages (MA): The 5-day MA has been fluctuating around the current price, indicating a lack of clear trend direction.
- MACD: The MACD line has been positive, suggesting a bullish momentum in the short term.
- EMA: The EMA has been slightly increasing, indicating a potential bullish sentiment in the market.
Momentum Indicators:
- RSI: The RSI has been hovering around the neutral zone, indicating a balanced momentum between buying and selling pressure.
- Stochastic Oscillator: Both %K and %D have been in the overbought territory, suggesting a potential reversal or consolidation.
- Williams %R: The indicator has been in the oversold region, signaling a possible buying opportunity.
Volatility Indicators:
- Bollinger Bands (BB): The bands have been relatively narrow, indicating low volatility in the stock price.
- BB %B: The %B indicator has been fluctuating around the midline, suggesting a lack of strong trend direction.
- BB Width: The width of the bands has been contracting, indicating a potential breakout or significant price movement ahead.
Volume Indicators:
- On-Balance Volume (OBV): The OBV has been fluctuating, indicating indecision among market participants.
- Chaikin Money Flow (CMF): The CMF has been slightly positive, suggesting some buying pressure in the market.
Key Observations:
- The trend indicators show a mixed signal with a slight bullish bias.
- Momentum indicators indicate a potential reversal or consolidation in the short term.
- Volatility indicators suggest a potential breakout or significant price movement.
- Volume indicators reflect indecision among market participants with a slight buying pressure.
Conclusion:
Based on the analysis of the technical indicators, the next few days for CRON could see sideways movement with a slight bullish bias. Traders should closely monitor key levels such as support and resistance to gauge the potential breakout or reversal. It is advisable to wait for a clear trend confirmation before making any significant trading decisions.