Technical Analysis of CPRT 2024-05-10
Overview:
In analyzing the technical indicators for CPRT over the last 5 days, we will delve into the trend, momentum, volatility, and volume indicators to provide a comprehensive outlook on the possible stock price movement in the coming days.
Trend Analysis:
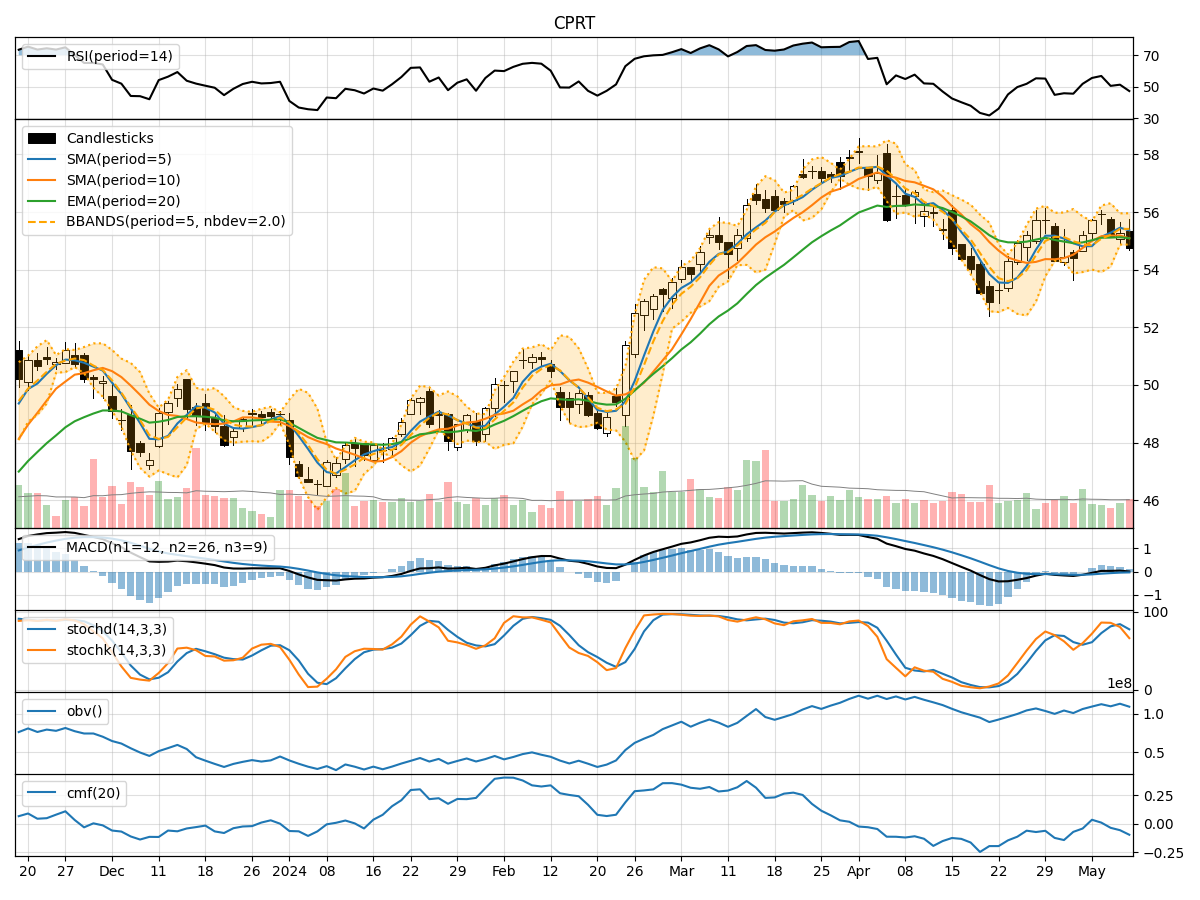
- Moving Averages (MA): The 5-day Moving Average (MA) has been fluctuating around the closing prices, indicating short-term price trends. The Simple Moving Average (SMA) and Exponential Moving Average (EMA) have shown slight variations but have generally been close to each other.
- Moving Average Convergence Divergence (MACD): The MACD and Signal Line have been positive, suggesting a bullish momentum in the stock price.
- Conclusion: The trend indicators point towards a bullish sentiment in the short term.
Momentum Analysis:
- Relative Strength Index (RSI): The RSI has been fluctuating but has generally stayed within the neutral to slightly overbought territory, indicating moderate buying pressure.
- Stochastic Oscillator: Both %K and %D have shown fluctuations but have generally been in the overbought region, suggesting potential for a pullback.
- Williams %R (Willams %R): The Williams %R has been in the oversold region, indicating a potential reversal in the stock price.
- Conclusion: The momentum indicators suggest a mixed sentiment with a slight bearish bias.
Volatility Analysis:
- Bollinger Bands (BB): The Bollinger Bands have shown narrowing bands, indicating decreasing volatility in the stock price.
- Conclusion: The volatility indicators suggest a decreasing volatility environment.
Volume Analysis:
- On-Balance Volume (OBV): The OBV has shown fluctuations but has not exhibited a clear trend, indicating mixed buying and selling pressure.
- Chaikin Money Flow (CMF): The CMF has been negative, suggesting a bearish money flow in the stock.
- Conclusion: The volume indicators point towards a neutral sentiment with a slight bearish bias.
Overall Conclusion:
Based on the analysis of the trend, momentum, volatility, and volume indicators, the next few days' possible stock price movement for CPRT is likely to be sideways to slightly bearish. While the trend indicators suggest a bullish sentiment, the momentum indicators show a mixed and slightly bearish bias. The decreasing volatility and neutral volume indicators further support the view of a sideways to slightly bearish movement.
Recommendation:
- Short-term Traders: Consider taking profits or implementing stop-loss strategies to manage risk in a potentially sideways market.
- Long-term Investors: Monitor the price action closely and wait for clearer signals before making significant investment decisions.
Always remember to conduct further research and consider fundamental factors alongside technical analysis for a well-rounded investment strategy.