Technical Analysis of COO 2024-05-10
Overview:
In analyzing the technical indicators for COO over the last 5 days, we will delve into the trend, momentum, volatility, and volume indicators to provide a comprehensive outlook on the possible stock price movement in the coming days.
Trend Analysis:
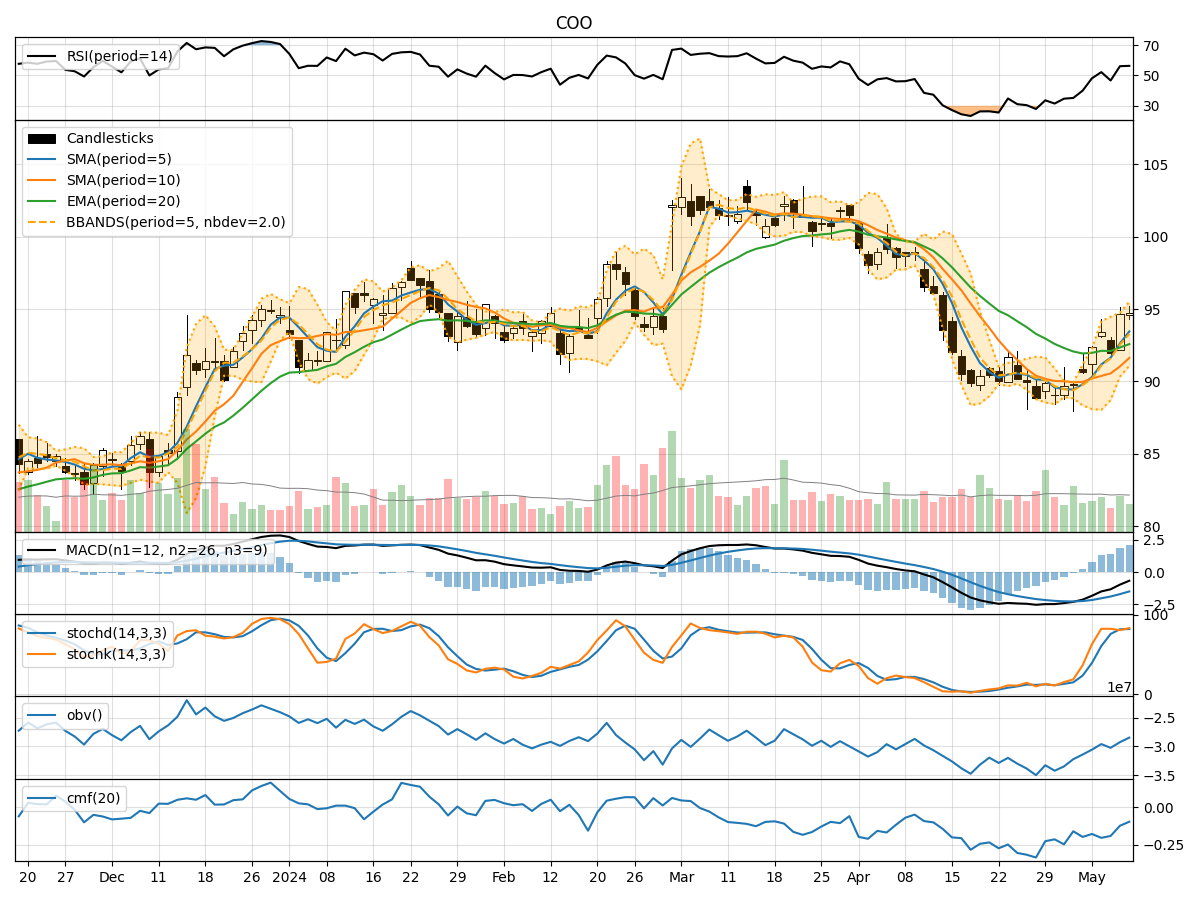
- Moving Averages (MA): The 5-day Moving Average (MA) has been consistently rising, indicating a bullish trend in the short term.
- MACD: The Moving Average Convergence Divergence (MACD) has been positive, with the MACD line above the signal line, suggesting bullish momentum.
Momentum Analysis:
- RSI: The Relative Strength Index (RSI) has been fluctuating around the 50 level, indicating a neutral momentum.
- Stochastic Oscillator: Both %K and %D have been in the overbought zone, suggesting a potential reversal or consolidation.
Volatility Analysis:
- Bollinger Bands (BB): The stock price has been trading near the upper Bollinger Band, indicating high volatility and a potential overbought condition.
Volume Analysis:
- On-Balance Volume (OBV): The OBV has been increasing, indicating accumulation by investors.
- Chaikin Money Flow (CMF): The CMF has been negative, suggesting selling pressure in the stock.
Key Observations:
- The trend indicators suggest a bullish sentiment in the short term.
- Momentum indicators show a neutral stance with a possibility of a reversal.
- Volatility indicators point towards high volatility and a potential overbought scenario.
- Volume indicators indicate accumulation but with selling pressure.
Conclusion:
Based on the analysis of the technical indicators, the next few days' possible stock price movement for COO is likely to experience a consolidation phase. The bullish trend may pause or reverse in the short term due to overbought conditions and neutral momentum. High volatility and selling pressure could lead to a sideways movement or a minor correction in the stock price. Investors should exercise caution and consider potential profit-taking opportunities in the current scenario.