Technical Analysis of CNTB 2024-05-10
Overview:
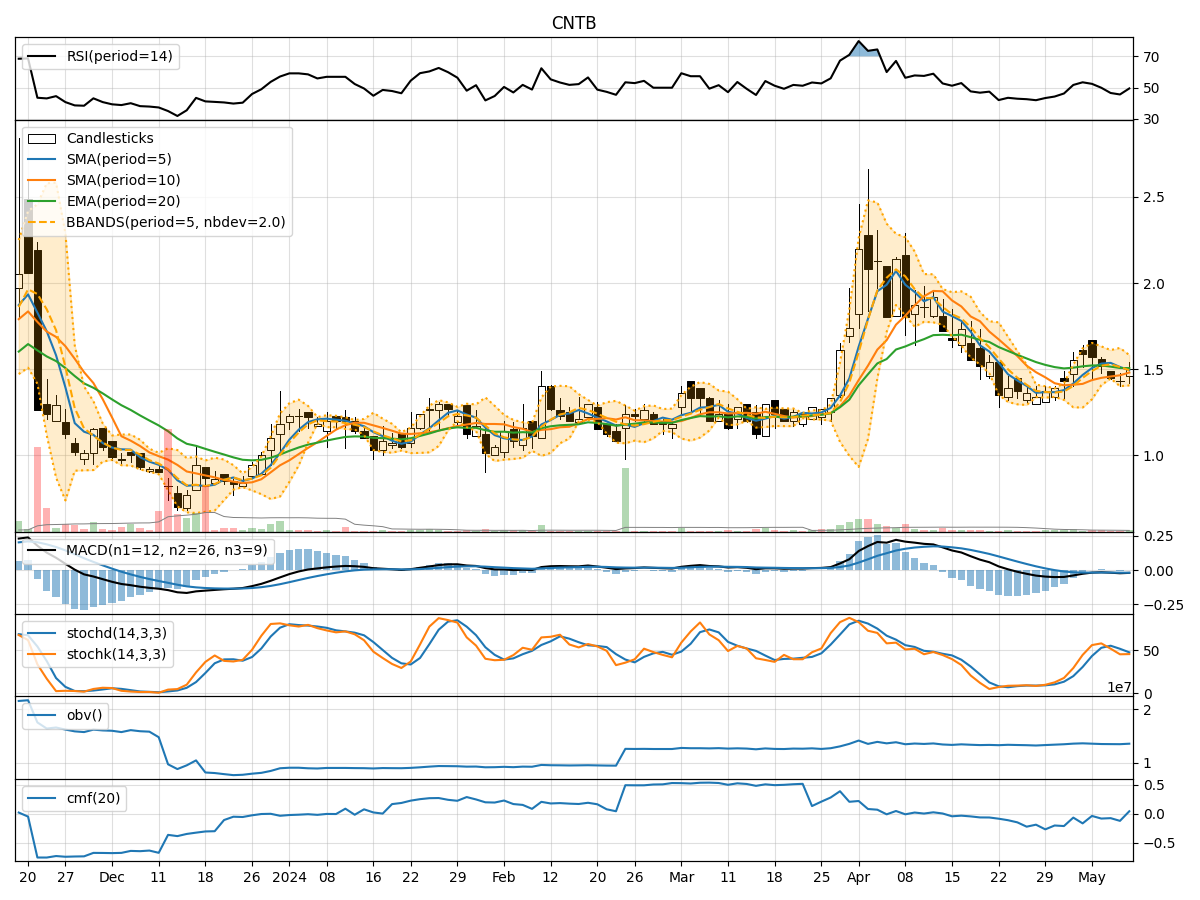
In analyzing the technical indicators for CNTB over the last 5 days, we will delve into the trend, momentum, volatility, and volume indicators to provide a comprehensive outlook on the possible stock price movement in the coming days.
Trend Analysis:
- Moving Averages (MA): The 5-day Moving Average (MA) has been fluctuating around the closing prices, indicating a lack of clear trend direction.
- MACD: The Moving Average Convergence Divergence (MACD) has been consistently negative, suggesting a bearish momentum in the short term.
- EMA: The Exponential Moving Average (EMA) has been declining, further supporting the bearish sentiment in the stock.
Momentum Analysis:
- RSI: The Relative Strength Index (RSI) has been hovering around the neutral zone, indicating a lack of strong momentum either bullish or bearish.
- Stochastic Oscillator: Both %K and %D of the Stochastic Oscillator have been fluctuating, not providing a clear signal on the stock's momentum.
- Williams %R: The Williams %R is in the oversold territory, suggesting a potential reversal or consolidation phase.
Volatility Analysis:
- Bollinger Bands (BB): The Bollinger Bands have been narrowing, indicating decreasing volatility in the stock price.
- BB% (BB Percentage): The BB% has been relatively low, signifying a period of consolidation or potential breakout.
Volume Analysis:
- On-Balance Volume (OBV): The OBV has been fluctuating, not showing a clear accumulation or distribution pattern.
- Chaikin Money Flow (CMF): The CMF has been negative, indicating potential selling pressure in the stock.
Key Observations:
- The stock is currently in a bearish phase based on the trend indicators like MACD and EMA.
- Momentum indicators like RSI and Stochastic Oscillator are neutral with a slight bearish bias.
- Volatility is decreasing as indicated by the narrowing Bollinger Bands.
- Volume indicators suggest mixed signals with OBV fluctuating and CMF showing selling pressure.
Conclusion:
Based on the analysis of the technical indicators, the next few days' possible stock price movement for CNTB is likely to be sideways to slightly bearish. The stock may experience a period of consolidation or a minor downward trend before potentially stabilizing. Traders should exercise caution and wait for clearer signals before making significant trading decisions.