Technical Analysis of CNTA 2024-05-10
Overview:
In analyzing the technical indicators for CNTA over the last 5 days, we will delve into the trend, momentum, volatility, and volume indicators to provide a comprehensive outlook on the possible stock price movement. By examining these key factors, we aim to offer valuable insights and predictions for the upcoming days.
Trend Analysis:
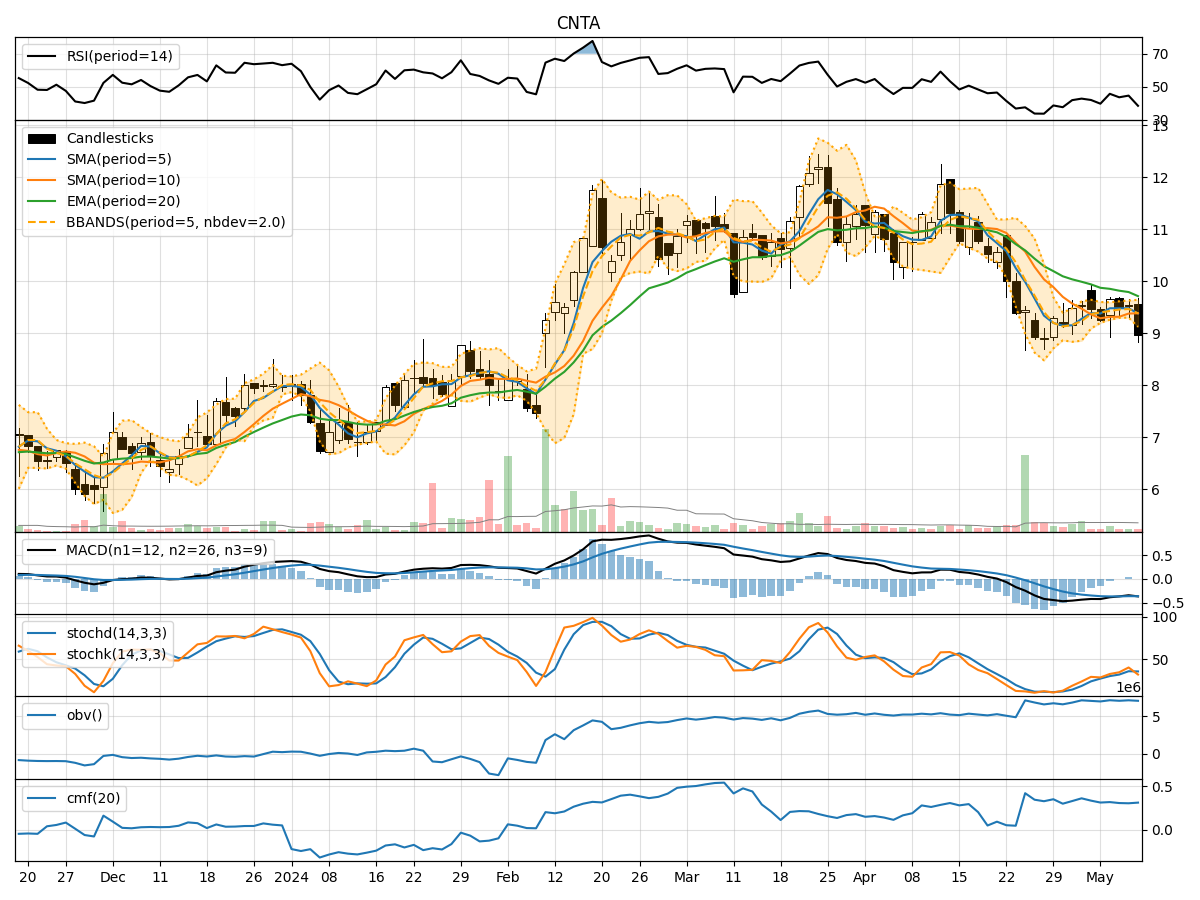
- Moving Averages (MA): The 5-day Moving Average (MA) has been fluctuating around the 9.4 level, indicating a relatively stable trend in the short term.
- MACD: The Moving Average Convergence Divergence (MACD) has been hovering around negative values, suggesting a bearish momentum in the stock.
- EMA: The Exponential Moving Average (EMA) has been gradually declining, reflecting a downward trend in the stock price.
Key Observation: The trend indicators point towards a bearish sentiment in the stock price movement.
Momentum Analysis:
- RSI: The Relative Strength Index (RSI) has been oscillating in the mid-range, indicating a lack of strong momentum in either direction.
- Stochastic Oscillator: Both %K and %D values have been fluctuating, showing indecision in the momentum of the stock.
- Williams %R: The Williams %R is in oversold territory, suggesting a potential reversal in the near future.
Key Observation: Momentum indicators suggest a neutral to slightly bearish momentum in the stock.
Volatility Analysis:
- Bollinger Bands: The Bollinger Bands have been narrowing, indicating decreasing volatility in the stock price.
- Bollinger %B: The %B value has been relatively low, suggesting the stock is trading near the lower band of the Bollinger Bands.
Key Observation: Volatility indicators signal a decrease in volatility and a potential consolidation phase in the stock price.
Volume Analysis:
- On-Balance Volume (OBV): The OBV has been relatively stable, indicating a balance between buying and selling pressure.
- Chaikin Money Flow (CMF): The CMF has been hovering around the neutral level, reflecting a lack of significant inflow or outflow of money.
Key Observation: Volume indicators suggest a balanced market sentiment with no clear dominance of buying or selling pressure.
Conclusion:
Based on the analysis of the technical indicators, the stock price of CNTA is likely to experience further downward movement in the next few days. The trend indicators point towards a bearish sentiment, supported by the momentum indicators showing a lack of strong upward momentum. Additionally, the volatility indicators signal a potential consolidation phase, while the volume indicators indicate a balanced market sentiment.
Overall Outlook: Bearish with a potential for sideways movement or consolidation in the near term. Traders and investors should exercise caution and consider risk management strategies in their decision-making process.