Technical Analysis of CNET 2024-05-10
Overview:
In analyzing the technical indicators for CNET over the last 5 days, we will delve into the trend, momentum, volatility, and volume indicators to provide a comprehensive outlook on the possible stock price movement. By examining these key factors, we aim to offer valuable insights and predictions for the upcoming days.
Trend Analysis:
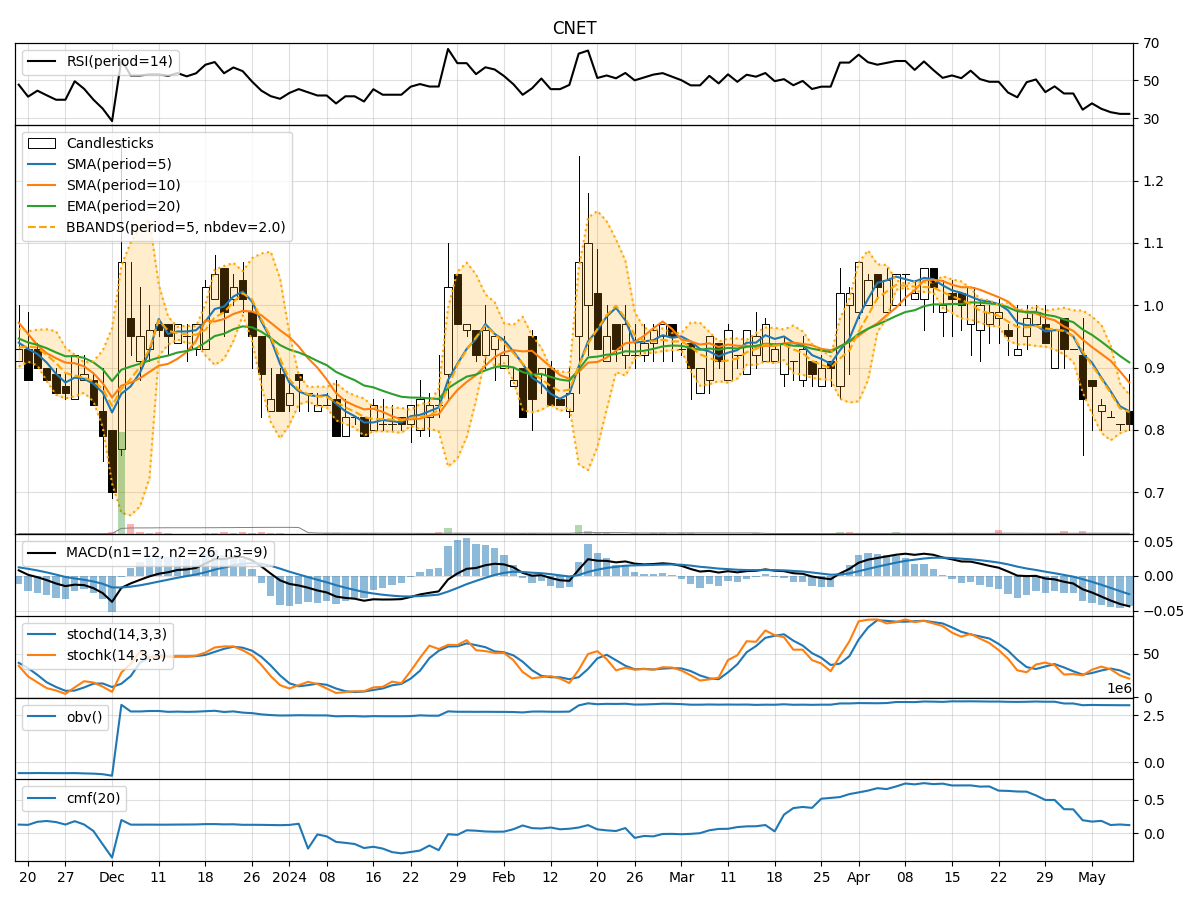
- Moving Averages (MA): The 5-day MA has been consistently decreasing, indicating a downward trend in the stock price.
- MACD: The MACD line has been decreasing, with the MACD histogram also showing a downward trend, suggesting bearish momentum.
Momentum Analysis:
- RSI: The RSI has been declining but is not yet in oversold territory, indicating potential further downside.
- Stochastic Oscillator: Both %K and %D have been decreasing, signaling weakening momentum.
Volatility Analysis:
- Bollinger Bands (BB): The stock price has been trading below the middle Bollinger Band, indicating a bearish trend.
Volume Analysis:
- On-Balance Volume (OBV): The OBV has been relatively flat, suggesting a lack of significant buying or selling pressure.
- Chaikin Money Flow (CMF): The CMF has been decreasing, indicating a potential outflow of money from the stock.
Key Observations:
- The stock is in a clear downtrend based on moving averages and MACD.
- Momentum indicators like RSI and Stochastic Oscillator suggest weakening momentum.
- Volatility indicators show a bearish trend with the stock trading below the middle Bollinger Band.
- Volume indicators indicate neutral sentiment with no significant buying or selling pressure.
Conclusion:
Based on the analysis of the technical indicators, the next few days for CNET are likely to see further downside movement. The stock is currently in a bearish phase, with momentum indicators supporting a potential continuation of the downtrend. Traders and investors should exercise caution and consider shorting or staying on the sidelines until a clear reversal pattern emerges.
Recommendation:
Given the bearish outlook, it may be prudent to wait for a reversal confirmation before considering any long positions. Monitoring key support levels and waiting for signs of bullish divergence on momentum indicators could provide a better entry point for potential long trades. Risk management strategies should be in place to protect against further downside risk.
Disclaimer:
Remember that technical analysis is not foolproof and should be used in conjunction with other forms of analysis. Market conditions can change rapidly, so it's essential to stay informed and adapt your strategies accordingly. Consulting with a financial advisor or conducting further research is always recommended before making any investment decisions.