Technical Analysis of CMMB 2024-05-10
Overview:
In analyzing the technical indicators for CMMB stock over the last 5 days, we will delve into the trend, momentum, volatility, and volume indicators to provide a comprehensive outlook on the possible future stock price movement. By examining these key indicators, we aim to offer valuable insights and predictions for the upcoming trading days.
Trend Analysis:
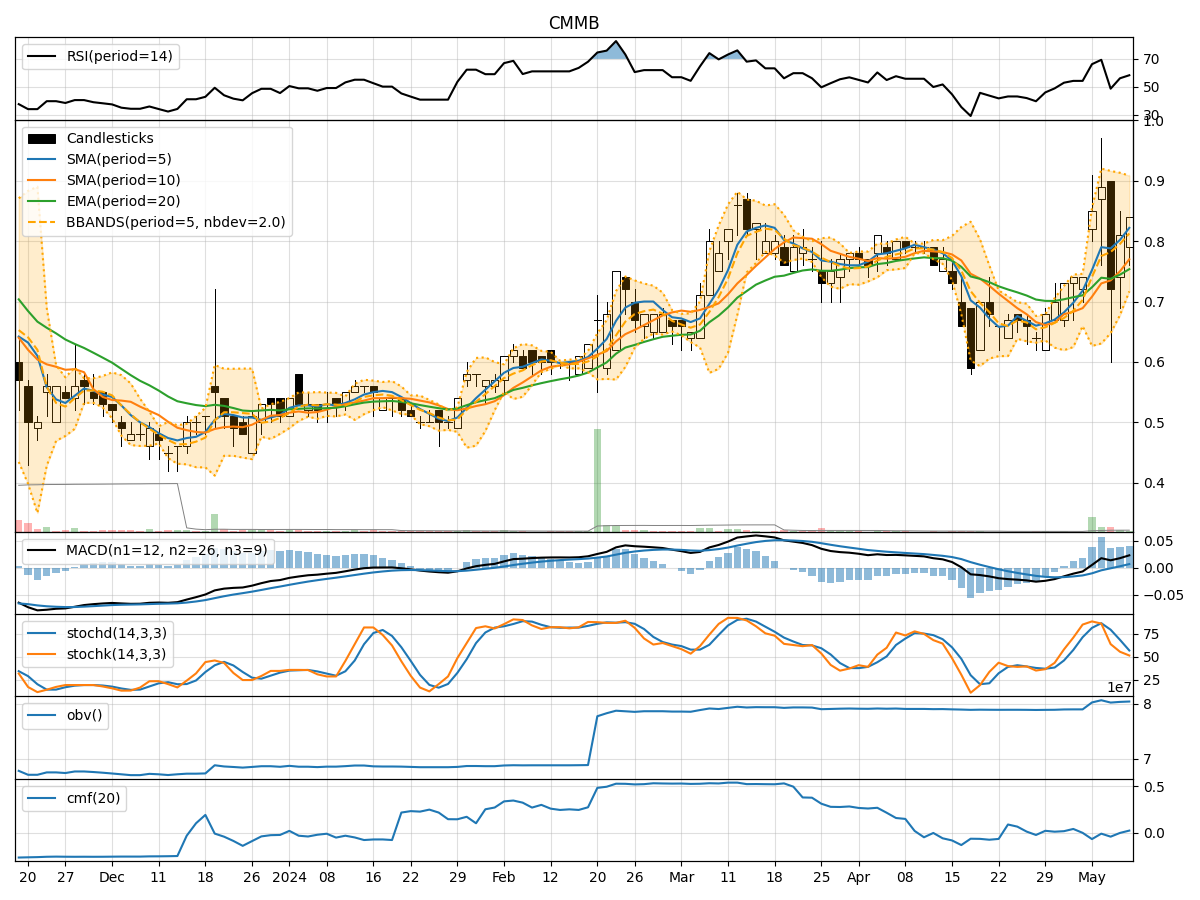
- Moving Averages (MA): The 5-day Moving Average (MA) has been showing an upward trend, indicating a positive momentum in the stock price.
- MACD: The Moving Average Convergence Divergence (MACD) has been consistently increasing, suggesting a strengthening bullish trend.
- EMA: The Exponential Moving Average (EMA) has also been on the rise, supporting the bullish sentiment in the short to medium term.
Momentum Analysis:
- RSI: The Relative Strength Index (RSI) has been hovering around the mid-range, indicating a neutral momentum in the stock.
- Stochastic Oscillator: Both %K and %D of the Stochastic Oscillator have been declining, signaling a potential reversal in momentum.
- Williams %R: The Williams %R is showing oversold conditions, hinting at a possible upcoming bullish reversal.
Volatility Analysis:
- Bollinger Bands (BB): The Bollinger Bands have been widening, suggesting increased volatility in the stock price.
- BB%: The %B indicator has been fluctuating within a wide range, reflecting the heightened volatility in the market.
Volume Analysis:
- On-Balance Volume (OBV): The OBV indicator has been relatively stable, indicating a balanced buying and selling pressure in the stock.
- Chaikin Money Flow (CMF): The CMF has been negative, suggesting a slight outflow of money from the stock.
Key Observations:
- The trend indicators point towards a bullish sentiment in the stock, supported by the increasing moving averages and MACD.
- Momentum indicators show a mixed signal, with RSI neutral, Stochastic Oscillator hinting at a potential reversal, and Williams %R signaling oversold conditions.
- Volatility has been on the rise, indicating potential price swings in the upcoming trading sessions.
- Volume indicators suggest a balanced buying and selling pressure, with a slight outflow of money based on the CMF.
Conclusion:
Based on the analysis of the technical indicators, the stock is likely to experience a bullish movement in the next few days. The trend indicators support a positive outlook, while the momentum indicators show signs of a potential reversal to the upside. Although volatility is high, it could present trading opportunities for investors. Overall, considering the current technical landscape, the stock is expected to trend upwards in the near term.