Technical Analysis of CME 2024-05-10
Overview:
In analyzing the technical indicators for CME over the last 5 days, we will delve into the trend, momentum, volatility, and volume indicators to provide a comprehensive outlook on the possible stock price movement in the coming days. By examining these key aspects, we aim to offer valuable insights and recommendations for your investment decisions.
Trend Analysis:
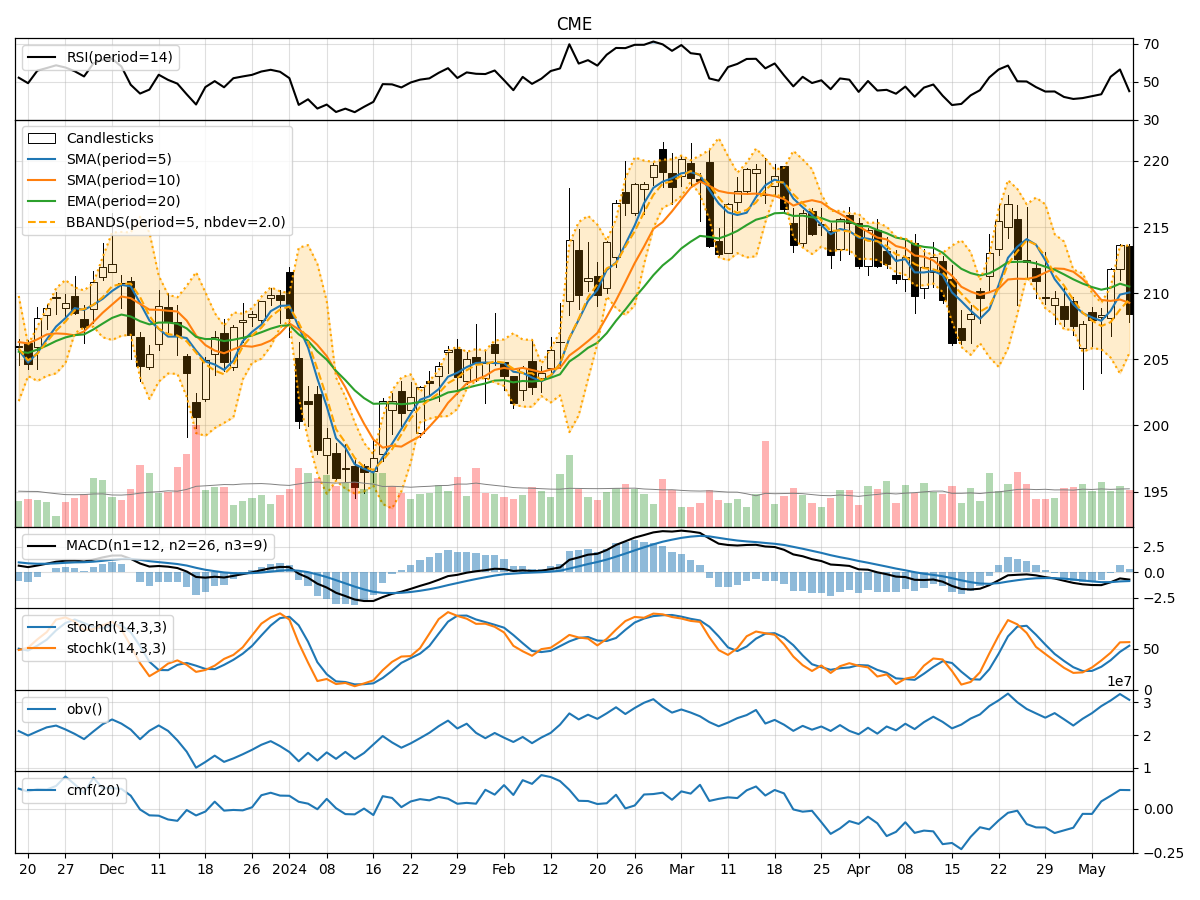
- Moving Averages (MA): The 5-day Moving Average (MA) has been fluctuating around the closing prices, indicating short-term price trends. The Simple Moving Average (SMA) and Exponential Moving Average (EMA) show a mixed trend, with the EMA slightly above the SMA.
- MACD: The Moving Average Convergence Divergence (MACD) has been negative, but the MACD Histogram (MACDH) has shown signs of improvement, moving closer to the zero line.
Momentum Analysis:
- RSI: The Relative Strength Index (RSI) has been fluctuating in the mid-range, suggesting a balanced momentum between buying and selling pressure.
- Stochastic Oscillator: Both %K and %D of the Stochastic Oscillator have been in the overbought territory, indicating a potential reversal in the short term.
- Williams %R: The Williams %R is in the oversold region, signaling a possible buying opportunity.
Volatility Analysis:
- Bollinger Bands (BB): The Bollinger Bands have widened, indicating increased volatility in the stock price. The current price is within the bands, suggesting a neutral stance.
- Bollinger %B: The %B indicator is below 1, indicating that the price is below the lower band, potentially signaling an oversold condition.
Volume Analysis:
- On-Balance Volume (OBV): The OBV has shown a slight increase over the last 5 days, indicating a positive volume flow into the stock.
- Chaikin Money Flow (CMF): The CMF has been positive, reflecting buying pressure in the stock over the past 20 days.
Conclusion:
Based on the analysis of the technical indicators: - Trend: The short-term trend is slightly bearish, but the MACDH moving towards the zero line could signal a potential reversal. - Momentum: The momentum indicators suggest a mixed sentiment, with the Stochastic Oscillator hinting at a possible reversal. - Volatility: The increased volatility and the %B indicator below 1 indicate a potential oversold condition. - Volume: The positive OBV and CMF point towards underlying strength in volume and buying pressure.
Overall View:
Considering the technical indicators and the current market dynamics, the stock price of CME may experience a short-term consolidation or sideways movement in the coming days. Traders should closely monitor the key support and resistance levels for potential entry or exit points. It is advisable to wait for further confirmation from the indicators before making significant trading decisions.