Technical Analysis of CLWT 2024-05-10
Overview:
In analyzing the technical indicators for CLWT over the last 5 days, we will delve into the trend, momentum, volatility, and volume indicators to provide a comprehensive outlook on the possible stock price movement in the coming days. By examining these key aspects, we aim to offer valuable insights and predictions to guide your investment decisions.
Trend Analysis:
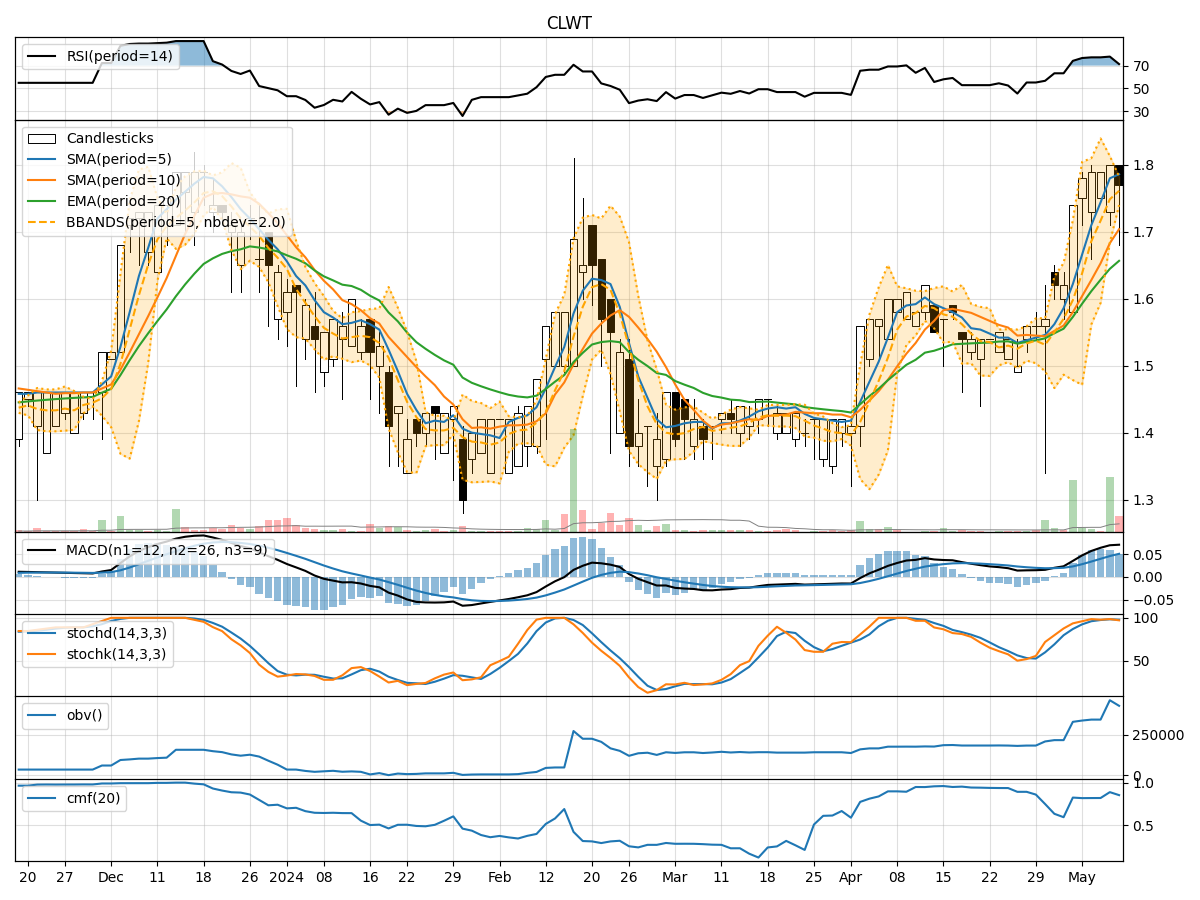
- Moving Averages (MA): The 5-day Moving Average (MA) has been consistently increasing, indicating a bullish trend in the short term.
- MACD: The MACD line has been above the signal line, suggesting a positive momentum in the stock price.
- EMA: The Exponential Moving Average (EMA) has been steadily rising, supporting the bullish trend.
Momentum Analysis:
- RSI: The Relative Strength Index (RSI) has been in the overbought territory, signaling a strong bullish momentum.
- Stochastic Oscillator: Both %K and %D have been high, indicating an overbought condition.
- Williams %R: The Williams %R is in the oversold region, suggesting a potential reversal in the short term.
Volatility Analysis:
- Bollinger Bands: The Bollinger Bands have been narrowing, indicating decreasing volatility and a possible period of consolidation.
- Bollinger %B: The %B indicator is hovering around the middle, suggesting a balanced market sentiment.
Volume Analysis:
- On-Balance Volume (OBV): The OBV has shown an overall increase, reflecting positive buying pressure.
- Chaikin Money Flow (CMF): The CMF has been positive, indicating strong buying interest in the stock.
Key Observations:
- The trend indicators point towards a bullish sentiment in the short term.
- Momentum indicators suggest a strong buying momentum but also hint at a potential reversal due to overbought conditions.
- Volatility indicators indicate a period of consolidation and decreasing volatility.
- Volume indicators show increasing buying pressure and positive market sentiment.
Conclusion:
Based on the analysis of the technical indicators, the next few days' possible stock price movement for CLWT is likely to be upward in the short term. However, caution is advised as the momentum indicators signal a potential reversal due to overbought conditions. Traders should closely monitor the price action and key support/resistance levels for timely decision-making.