Technical Analysis of CLEU 2024-05-10
Overview:
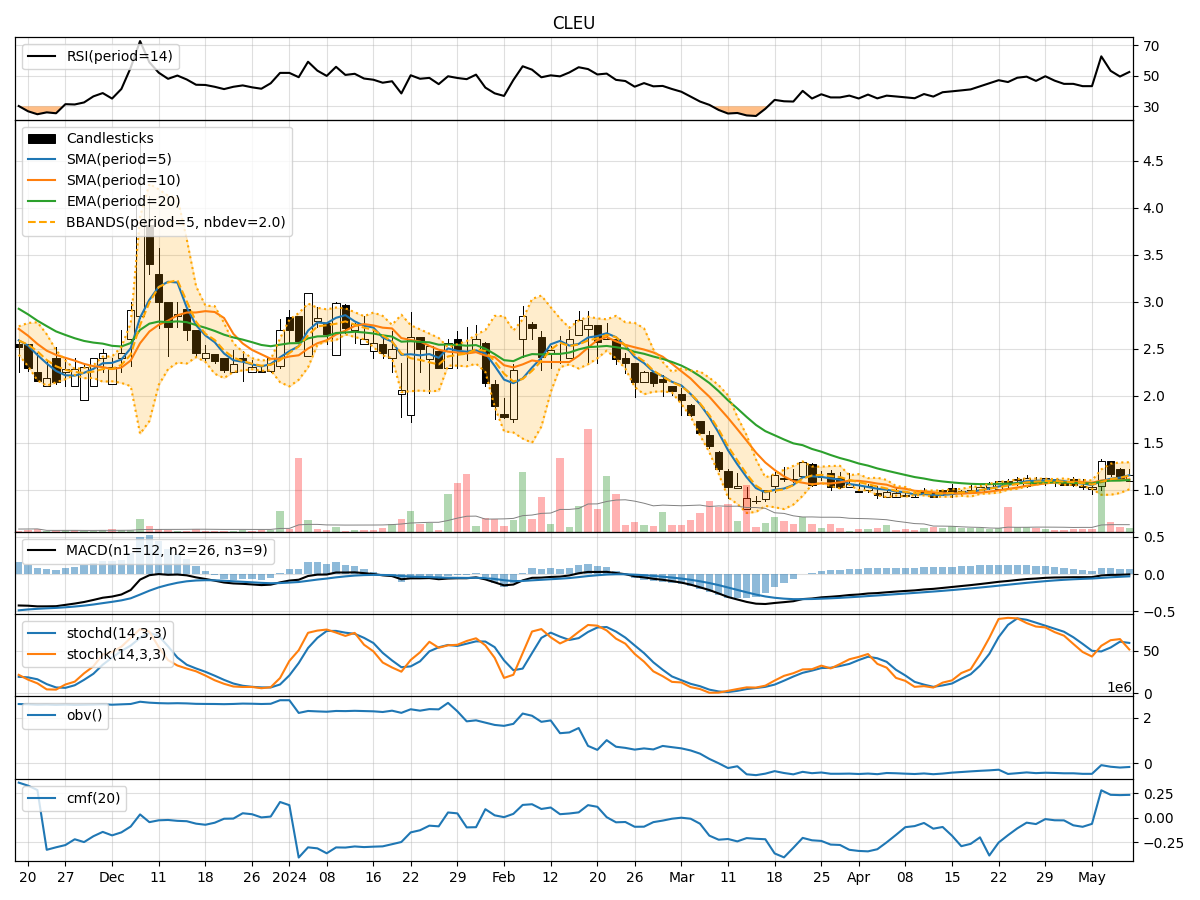
In analyzing the technical indicators for CLEU over the last 5 days, we will delve into the trend, momentum, volatility, and volume indicators to provide a comprehensive outlook on the possible stock price movement in the coming days. By examining these key aspects, we aim to offer valuable insights and predictions for informed decision-making.
Trend Analysis:
- Moving Averages (MA): The 5-day Moving Average (MA) has been fluctuating around the closing prices, indicating short-term price trends. The Simple Moving Average (SMA) and Exponential Moving Average (EMA) show a slight convergence, suggesting a potential reversal or consolidation.
- MACD: The Moving Average Convergence Divergence (MACD) has been negative but narrowing, indicating a possible shift towards a bullish momentum.
- MACD Histogram: The MACD Histogram has been consistently positive, reflecting increasing bullish momentum.
Momentum Analysis:
- RSI: The Relative Strength Index (RSI) has been oscillating within the neutral zone, indicating indecision in the market.
- Stochastic Oscillator: Both %K and %D lines of the Stochastic Oscillator have been fluctuating, suggesting a lack of clear trend direction.
- Williams %R: The Williams %R shows oversold conditions, indicating a potential buying opportunity.
Volatility Analysis:
- Bollinger Bands (BB): The Bollinger Bands have been narrowing, indicating decreasing volatility and a possible price breakout in the near future.
- Bollinger %B: The %B indicator shows the price nearing the lower band, suggesting a potential reversal or bounce.
Volume Analysis:
- On-Balance Volume (OBV): The OBV has been negative, indicating distribution and selling pressure in the stock.
- Chaikin Money Flow (CMF): The CMF has been positive, suggesting some buying interest despite the negative OBV.
Key Observations:
- The trend indicators show a potential reversal or consolidation in the short term.
- Momentum indicators reflect indecision and lack of clear trend direction.
- Volatility indicators point towards a potential breakout with decreasing volatility.
- Volume indicators indicate selling pressure but with some buying interest.
Conclusion:
Based on the analysis of the technical indicators, the stock of CLEU is likely to experience sideways movement in the coming days. The narrowing Bollinger Bands and decreasing volatility suggest a potential price breakout, while the mixed signals from momentum indicators indicate a lack of clear trend direction. The stock may consolidate before a possible bullish or bearish move. Traders should closely monitor key support and resistance levels for potential entry or exit points.