Technical Analysis of CLBT 2024-05-10
Overview:
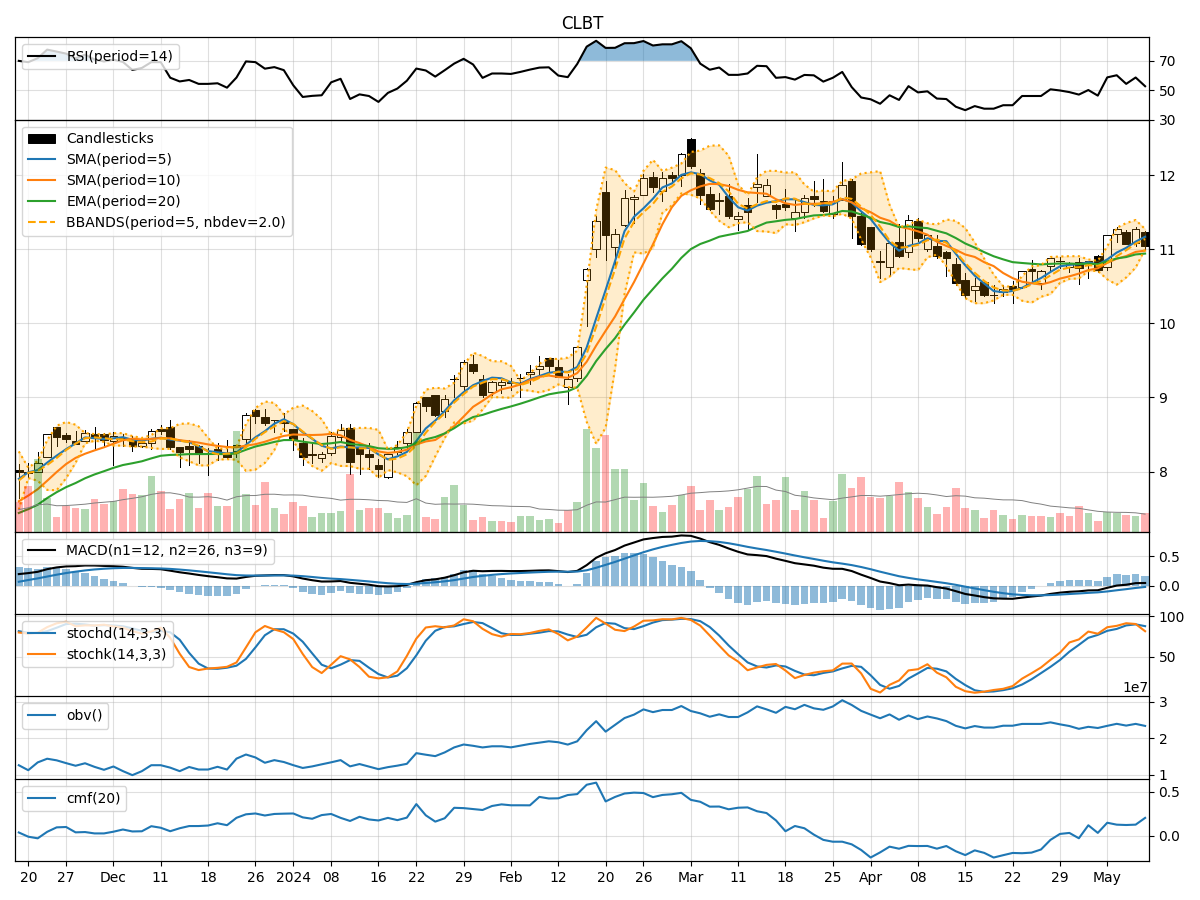
In analyzing the technical indicators for CLBT over the last 5 days, we will delve into the trend, momentum, volatility, and volume indicators to provide a comprehensive outlook on the possible stock price movement. By examining these key aspects, we aim to offer valuable insights and predictions for the upcoming trading days.
Trend Analysis:
- Moving Averages (MA): The 5-day Moving Average (MA) has been consistently above the Simple Moving Average (SMA) and Exponential Moving Average (EMA), indicating a bullish trend.
- MACD: The MACD line has been positive, with the MACD Histogram showing an upward trend, suggesting bullish momentum in the stock price.
Momentum Analysis:
- RSI: The Relative Strength Index (RSI) has been fluctuating around the neutral zone, indicating a lack of strong momentum in either direction.
- Stochastic Oscillator: The Stochastic Oscillator has shown mixed signals, with occasional overbought and oversold conditions, reflecting indecision in the market.
Volatility Analysis:
- Bollinger Bands (BB): The Bollinger Bands have shown narrowing bands, suggesting decreasing volatility in the stock price.
- Bollinger %B (BBP): The %B indicator has been hovering around the middle range, indicating a balanced volatility level.
Volume Analysis:
- On-Balance Volume (OBV): The OBV indicator has shown a slight increase, indicating a potential accumulation of the stock.
- Chaikin Money Flow (CMF): The CMF has been positive, signaling buying pressure in the market.
Key Observations:
- The trend indicators suggest a bullish sentiment in the stock price, supported by positive MACD signals.
- Momentum indicators show a lack of strong momentum, with RSI hovering around neutrality.
- Volatility indicators point towards decreasing volatility, potentially leading to a consolidation phase.
- Volume indicators indicate a slight increase in buying pressure, as reflected in the OBV and CMF readings.
Conclusion:
Based on the analysis of the technical indicators, the next few days for CLBT are likely to see sideways movement with a slight bullish bias. The stock price may consolidate within a narrow range, supported by the positive trend signals and decreasing volatility. However, the lack of strong momentum and mixed signals from the momentum indicators suggest a cautious approach. Traders should closely monitor key support and resistance levels for potential breakout opportunities.