Technical Analysis of CLBK 2024-05-31
Overview:
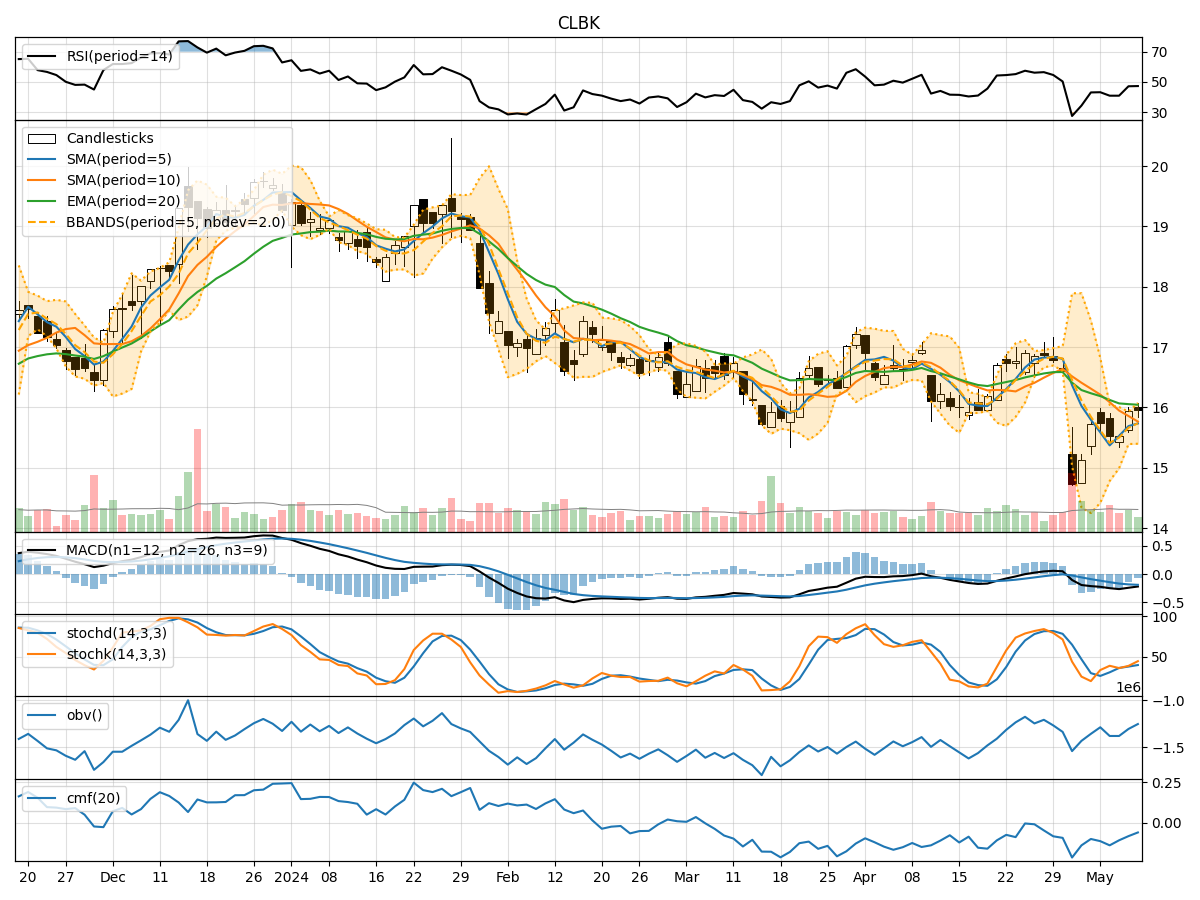
In analyzing the technical indicators for CLBK over the last 5 days, we will delve into the trend, momentum, volatility, and volume indicators to provide a comprehensive outlook on the possible stock price movement. By examining these key aspects, we aim to offer valuable insights and predictions for the upcoming days.
Trend Analysis:
- Moving Averages (MA): The 5-day MA has been consistently decreasing, indicating a downward trend in the stock price.
- MACD: The MACD line has been negative and declining, suggesting bearish momentum in the stock.
- EMA: The EMA has also been trending downwards, reinforcing the bearish sentiment in the stock.
Momentum Analysis:
- RSI: The RSI has been below 50, indicating bearish momentum in the stock.
- Stochastic Oscillator: Both %K and %D have been in oversold territory, signaling a potential reversal or continuation of the downtrend.
- Williams %R: The Williams %R has been consistently in oversold territory, suggesting a bearish outlook.
Volatility Analysis:
- Bollinger Bands (BB): The stock price has been consistently below the lower Bollinger Band, indicating oversold conditions and potential for a reversal.
- Bollinger Band Width: The BB Width has been expanding, suggesting increased volatility in the stock.
- Bollinger Band %B: The %B has been below 0.2, indicating the stock is oversold.
Volume Analysis:
- On-Balance Volume (OBV): The OBV has been declining, indicating selling pressure in the stock.
- Chaikin Money Flow (CMF): The CMF has been negative, suggesting outflow of money from the stock.
Key Observations:
- The stock is currently in a downtrend based on moving averages, MACD, and EMA.
- Momentum indicators like RSI and Stochastic Oscillator suggest bearish momentum in the stock.
- Volatility indicators show that the stock is oversold and experiencing increased volatility.
- Volume indicators indicate selling pressure and negative money flow in the stock.
Conclusion:
Based on the analysis of the technical indicators, the next few days are likely to see a continuation of the downward trend in CLBK. The stock is currently in a bearish phase with oversold conditions, indicating a potential for a further decline in stock price. Traders and investors should exercise caution and consider short-term strategies aligned with the prevailing bearish sentiment in the stock.