Technical Analysis of CISS 2024-05-10
Overview:
In analyzing the technical indicators for CISS stock over the last 5 days, we will delve into the trend, momentum, volatility, and volume indicators to provide a comprehensive outlook on the possible stock price movement in the coming days.
Trend Analysis:
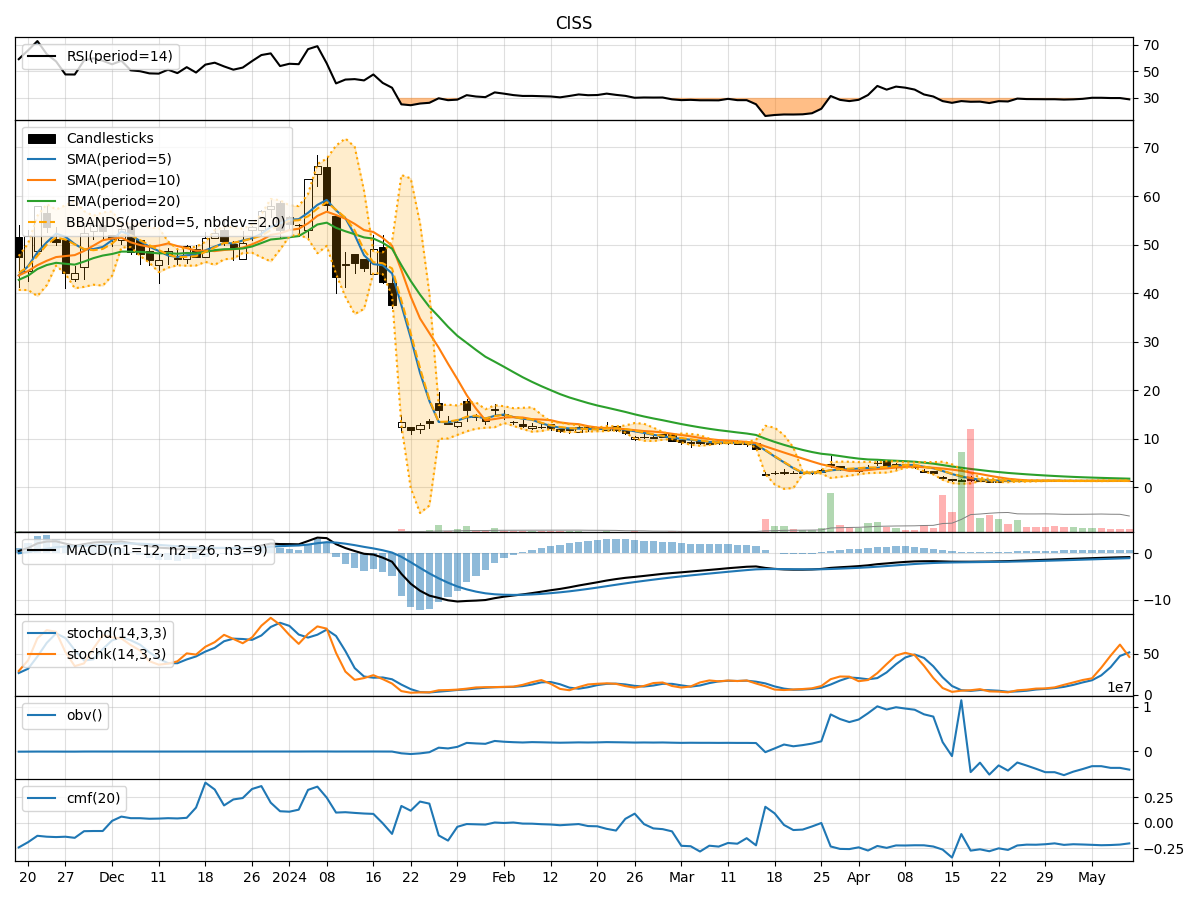
- Moving Averages (MA): The 5-day Moving Average (MA) has been fluctuating around the 1.34-1.35 range, indicating a relatively stable trend in the short term.
- MACD: The Moving Average Convergence Divergence (MACD) has been negative but showing signs of convergence, suggesting a potential shift in momentum.
- EMA: The Exponential Moving Average (EMA) has been declining, indicating a bearish trend in the medium term.
Momentum Analysis:
- RSI: The Relative Strength Index (RSI) has been in the oversold territory, indicating a potential reversal or consolidation phase.
- Stochastic Oscillator: The Stochastic Oscillator has shown mixed signals, with fluctuations in both %K and %D values.
- Williams %R: The Williams %R has been in the oversold region, signaling a potential buying opportunity.
Volatility Analysis:
- Bollinger Bands: The Bollinger Bands have shown narrowing bands, suggesting decreasing volatility in the stock price.
- Bollinger %B: The %B indicator has been hovering around the lower band, indicating a possible oversold condition.
Volume Analysis:
- On-Balance Volume (OBV): The OBV has been declining, indicating selling pressure in the stock.
- Chaikin Money Flow (CMF): The CMF has been negative, reflecting a bearish money flow trend.
Key Observations:
- The stock has been trading within a narrow range with declining moving averages and negative EMA, indicating a bearish bias in the medium term.
- Momentum indicators suggest a potential reversal or consolidation phase, with oversold conditions in RSI and Williams %R.
- Volatility has been decreasing, as indicated by the narrowing Bollinger Bands, while volume indicators show selling pressure with a negative OBV and CMF.
Conclusion:
Based on the analysis of the technical indicators, the stock is likely to experience further downward movement in the short to medium term. The bearish trend indicated by the moving averages and EMA, coupled with selling pressure shown in volume indicators, suggests a continuation of the current downtrend. Traders should exercise caution and consider shorting opportunities or wait for a clear reversal signal before considering long positions.