Technical Analysis of CHTR 2024-05-10
Overview:
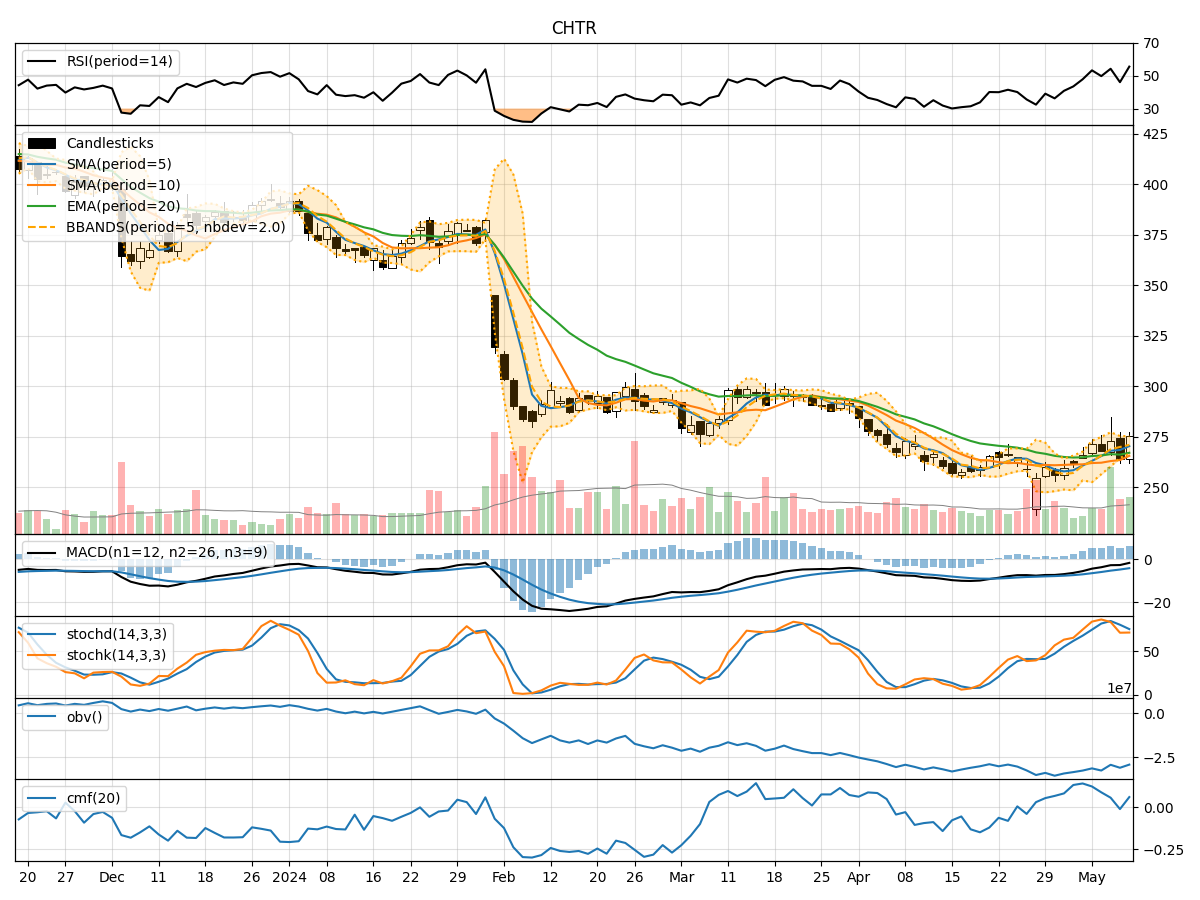
In analyzing the technical indicators for CHTR over the last 5 days, we will delve into the trend, momentum, volatility, and volume indicators to provide a comprehensive outlook on the possible stock price movement in the coming days.
Trend Indicators:
- Moving Averages (MA): The 5-day MA has been consistently above the closing prices, indicating a short-term bullish trend.
- MACD: The MACD line has been above the signal line, suggesting bullish momentum.
- RSI: The RSI has been fluctuating around the 50 level, indicating indecision in the market.
Momentum Indicators:
- Stochastic Oscillator: The stochastic oscillator has been fluctuating within the overbought and oversold levels, reflecting mixed momentum.
- Williams %R: The Williams %R has been moving between the overbought and oversold zones, signaling indecision.
Volatility Indicators:
- Bollinger Bands: The price has been trading within the Bollinger Bands, suggesting a period of consolidation.
- Average True Range (ATR): The ATR has been relatively stable, indicating consistent volatility levels.
Volume Indicators:
- On-Balance Volume (OBV): The OBV has been fluctuating, indicating mixed buying and selling pressure.
- Chaikin Money Flow (CMF): The CMF has been positive but trending downwards, suggesting weakening buying pressure.
Key Observations:
- The trend indicators show a bullish bias in the short term.
- Momentum indicators reflect mixed signals with no clear direction.
- Volatility indicators point towards a period of consolidation.
- Volume indicators indicate a lack of strong buying or selling pressure.
Conclusion:
Based on the analysis of the technical indicators, the next few days for CHTR are likely to see sideways movement with limited volatility. The stock may consolidate within a range as the market lacks a clear direction. Traders should exercise caution and wait for a clearer trend to emerge before taking significant positions.