Technical Analysis of CHRW 2024-05-10
Overview:
In analyzing the technical indicators for CHRW over the last 5 days, we will delve into the trend, momentum, volatility, and volume indicators to provide a comprehensive outlook on the possible stock price movement in the coming days. By examining these key aspects, we aim to offer valuable insights and predictions for informed decision-making.
Trend Analysis:
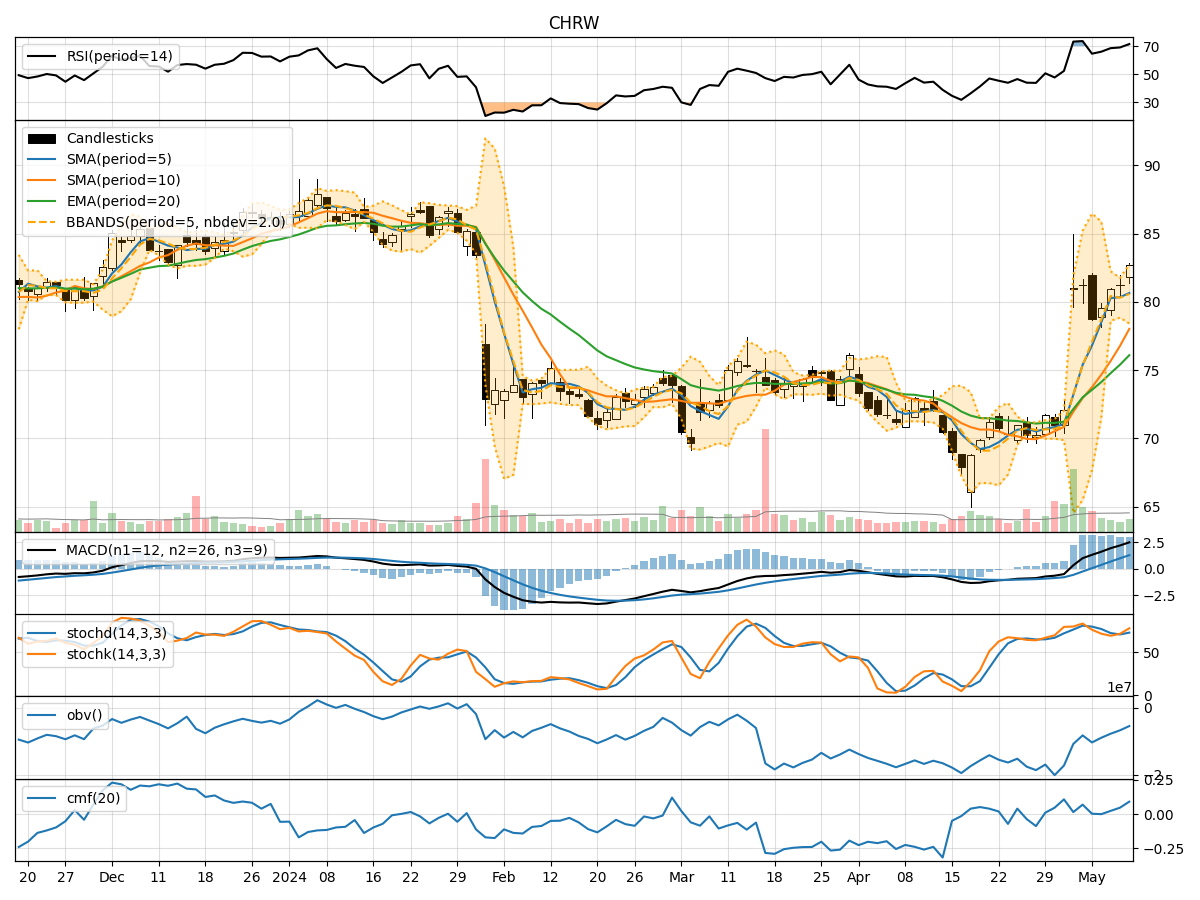
- Moving Averages (MA): The 5-day Moving Average has been consistently rising, indicating a bullish trend in the short term.
- MACD: The MACD line has been above the signal line, suggesting a bullish momentum.
- RSI: The Relative Strength Index has been trending upwards, reflecting increasing buying pressure.
Momentum Analysis:
- Stochastic Oscillator: Both %K and %D have been in the overbought zone, signaling a potential reversal or consolidation.
- Williams %R: The indicator has been in the oversold territory, indicating a possible buying opportunity.
Volatility Analysis:
- Bollinger Bands: The stock price has been trading near the upper Bollinger Band, suggesting an overbought condition.
- Volatility: The volatility has been relatively high, indicating potential price fluctuations.
Volume Analysis:
- On-Balance Volume (OBV): The OBV has been increasing, showing accumulation by investors.
- Chaikin Money Flow (CMF): The CMF has been positive, indicating buying pressure.
Key Observations:
- The trend indicators suggest a bullish sentiment in the short term.
- Momentum indicators show signs of potential reversal or consolidation.
- Volatility indicators point towards overbought conditions.
- Volume indicators indicate accumulation and buying pressure.
Conclusion:
Based on the analysis of the technical indicators, the stock price of CHRW is likely to experience a short-term consolidation or pullback due to the overbought conditions indicated by the momentum and volatility indicators. Traders should exercise caution and consider taking profits or waiting for a better entry point. Long-term investors may view this as a healthy correction within the overall bullish trend and an opportunity to add to their positions. It is essential to monitor the price action closely and consider risk management strategies in the current market environment.