Technical Analysis of CHKP 2024-05-10
Overview:
In analyzing the technical indicators for CHKP over the last 5 days, we will delve into the trend, momentum, volatility, and volume indicators to provide a comprehensive outlook on the possible stock price movement in the coming days.
Trend Analysis:
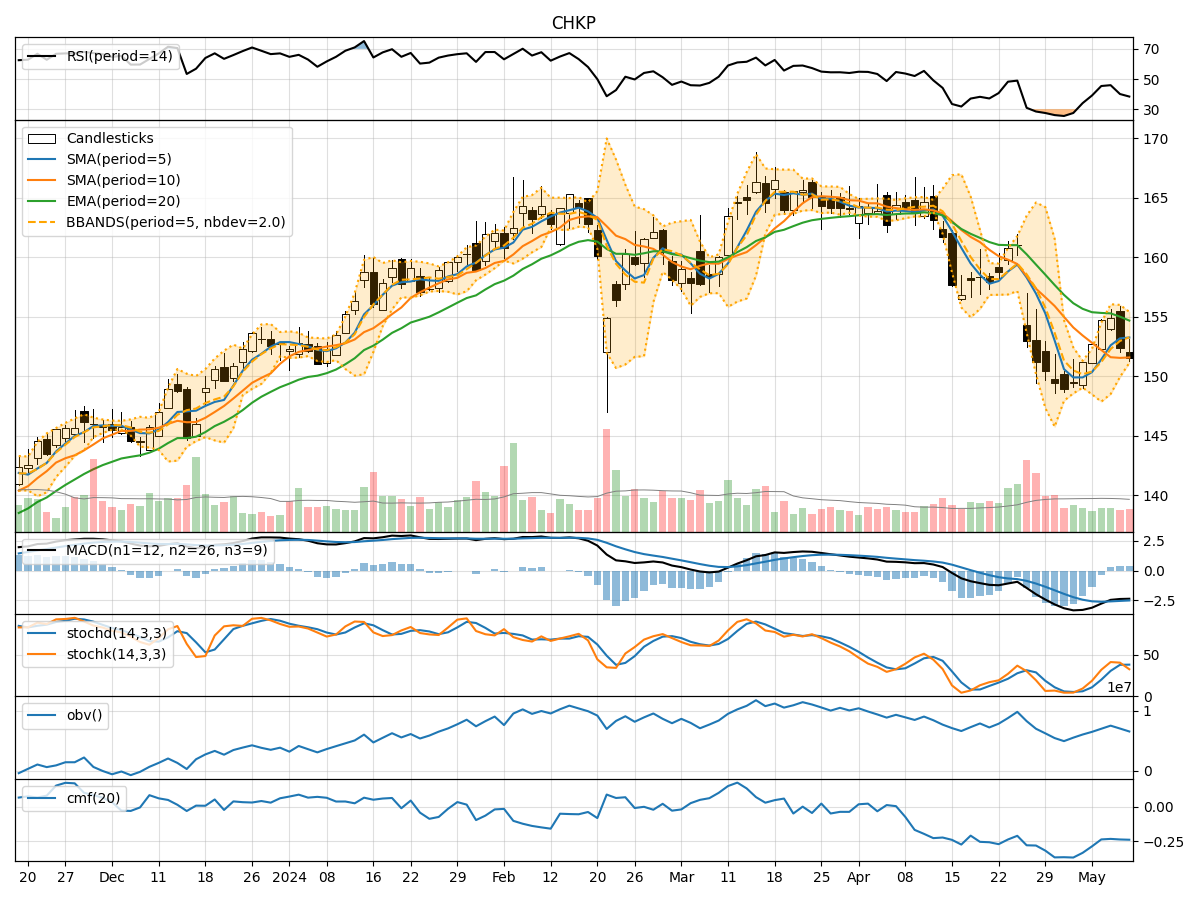
- Moving Averages (MA): The 5-day Moving Average (MA) has been consistently above the Simple Moving Average (SMA) and Exponential Moving Average (EMA) over the past 5 days, indicating a short-term bullish trend.
- MACD: The MACD line has been consistently below the signal line, suggesting a bearish momentum in the stock price.
- Conclusion: The moving averages indicate a bullish trend, but the MACD signals a bearish momentum.
Momentum Analysis:
- RSI: The Relative Strength Index (RSI) has been fluctuating around the 40-50 range, indicating a neutral momentum.
- Stochastic Oscillator: Both %K and %D have been hovering around the mid-range, suggesting a lack of strong momentum.
- Conclusion: The momentum indicators suggest a neutral stance with no clear direction.
Volatility Analysis:
- Bollinger Bands (BB): The stock price has been trading within the Bollinger Bands, with the bands narrowing over the past few days, indicating decreasing volatility.
- Conclusion: The narrowing Bollinger Bands suggest a period of consolidation and decreased volatility.
Volume Analysis:
- On-Balance Volume (OBV): The OBV has been declining over the last 5 days, indicating selling pressure in the stock.
- Chaikin Money Flow (CMF): The CMF has also been negative, reflecting a bearish sentiment.
- Conclusion: The volume indicators point towards a bearish sentiment with selling pressure.
Overall Conclusion:
Based on the analysis of the technical indicators, the stock price of CHKP is likely to experience a period of consolidation with a bearish bias in the coming days. The trend indicators suggest a bullish trend, but the momentum, volume, and volatility indicators point towards a lack of strong momentum, selling pressure, and decreased volatility, respectively.
Recommendation:
- Short-term Traders: Consider staying cautious and monitoring the stock closely for any potential breakdown below key support levels.
- Long-term Investors: Evaluate the fundamental factors alongside technical indicators before making any investment decisions.
Disclaimer:
Remember that technical analysis is not a guaranteed predictor of future price movements, and other fundamental factors can influence stock prices. It is essential to conduct thorough research and consider multiple indicators before making any investment decisions. Consulting with a financial advisor can provide tailored insights based on your specific investment goals and risk tolerance level.