Technical Analysis of CGNT 2024-05-10
Overview:
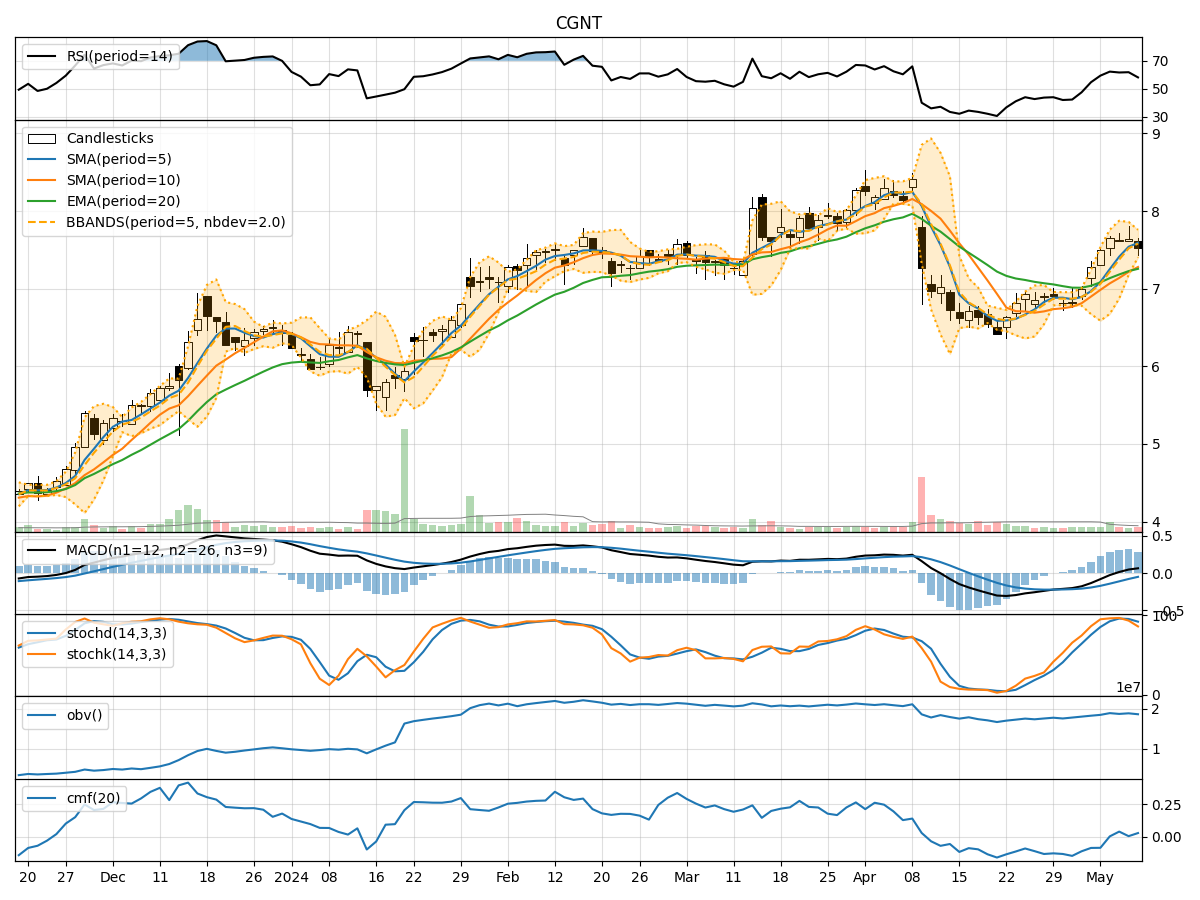
In analyzing the technical indicators for CGNT over the last 5 days, we will delve into the trend, momentum, volatility, and volume indicators to provide a comprehensive outlook on the possible stock price movement in the coming days. By examining these key indicators, we aim to offer valuable insights and recommendations for potential investors.
Trend Analysis:
- Moving Averages (MA): The 5-day Moving Average (MA) has been consistently above the Simple Moving Average (SMA) and Exponential Moving Average (EMA), indicating a bullish trend.
- MACD: The MACD line has been consistently above the signal line, suggesting a bullish momentum in the stock price.
- RSI: The Relative Strength Index (RSI) has been fluctuating around the 60-70 range, indicating a neutral to slightly bullish sentiment.
Momentum Analysis:
- Stochastic Oscillator: The Stochastic Oscillator has been in the overbought territory, suggesting a potential reversal or consolidation phase.
- Williams %R: The Williams %R indicator has been in the oversold territory, indicating a bearish sentiment in the short term.
Volatility Analysis:
- Bollinger Bands (BB): The Bollinger Bands have been narrowing, indicating decreasing volatility in the stock price.
- BB %B: The %B indicator has been decreasing, suggesting a potential consolidation phase or a reversal in the stock price.
Volume Analysis:
- On-Balance Volume (OBV): The OBV has been fluctuating, indicating mixed buying and selling pressure in the stock.
- Chaikin Money Flow (CMF): The CMF has been positive but relatively flat, suggesting a neutral sentiment in terms of money flow.
Conclusion:
Based on the analysis of the technical indicators, the stock of CGNT is likely to experience sideways movement in the coming days. The bullish trend indicated by moving averages and MACD is countered by the overbought Stochastic and oversold Williams %R, suggesting a potential consolidation phase. The decreasing volatility and mixed volume indicators further support the view of a sideways movement.
Recommendation:
Considering the mixed signals from the technical indicators, it is advisable for investors to exercise caution and closely monitor the stock price movement. It may be prudent to wait for clearer signals or confirmation of a trend before making significant trading decisions. Conducting further analysis and staying updated on market developments will be crucial in navigating the potential sideways movement of CGNT stock.