Technical Analysis of CG 2024-05-31
Overview:
In analyzing the technical indicators for CG stock over the last 5 days, we will delve into the trends, momentum, volatility, and volume aspects to provide a comprehensive outlook on the possible stock price movement in the upcoming days. By examining key indicators such as moving averages, MACD, RSI, Bollinger Bands, and OBV, we aim to offer valuable insights and predictions for informed decision-making.
Trend Analysis:
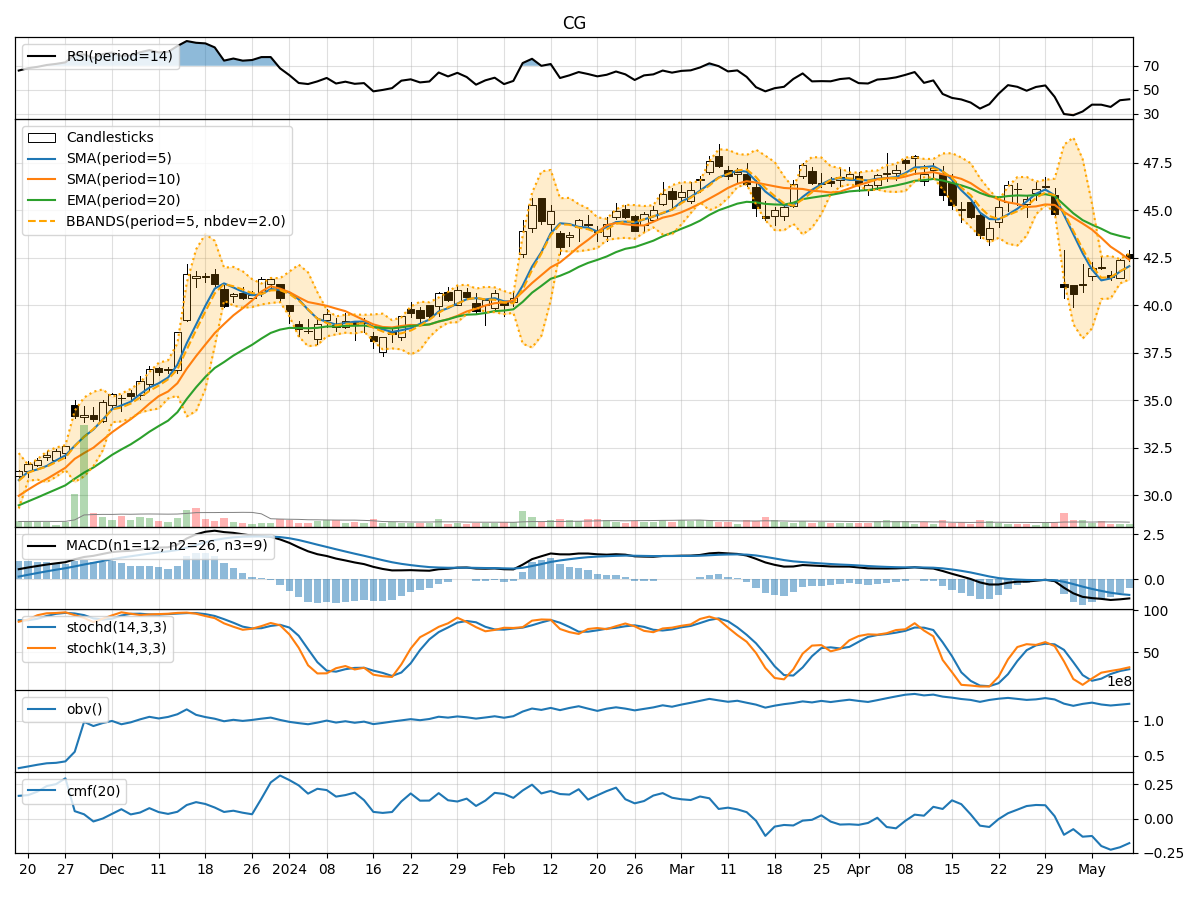
- Moving Averages (MA): The 5-day MA has been fluctuating around the closing prices, indicating short-term price trends. The SMA(10) and EMA(20) show a slight decline, suggesting a weakening trend.
- MACD: The MACD line has been negative, with the MACD histogram showing a decreasing trend, indicating bearish momentum.
Momentum Analysis:
- RSI: The RSI values have been declining, indicating a loss in bullish momentum and potential oversold conditions.
- Stochastic Oscillator: Both %K and %D values have been decreasing, signaling a bearish momentum shift.
Volatility Analysis:
- Bollinger Bands (BB): The bands have been narrowing, suggesting decreasing volatility and a possible period of consolidation.
Volume Analysis:
- On-Balance Volume (OBV): The OBV values have been decreasing, indicating selling pressure and potential bearish sentiment.
Key Observations:
- The stock is currently in a downtrend based on moving averages and MACD indicators.
- Momentum indicators like RSI and Stochastic Oscillator point towards bearish sentiment and potential oversold conditions.
- Volatility is decreasing, indicating a possible consolidation phase in the stock price.
- The declining OBV suggests increased selling pressure and a lack of strong buying interest.
Conclusion:
Based on the analysis of the technical indicators, the next few days for CG stock are likely to see a continuation of the downtrend with bearish momentum prevailing. The stock may experience further price declines or enter a consolidation phase with limited volatility. Investors should exercise caution and consider waiting for more positive signals before considering any long positions.