Technical Analysis of CETU 2024-05-10
Overview:
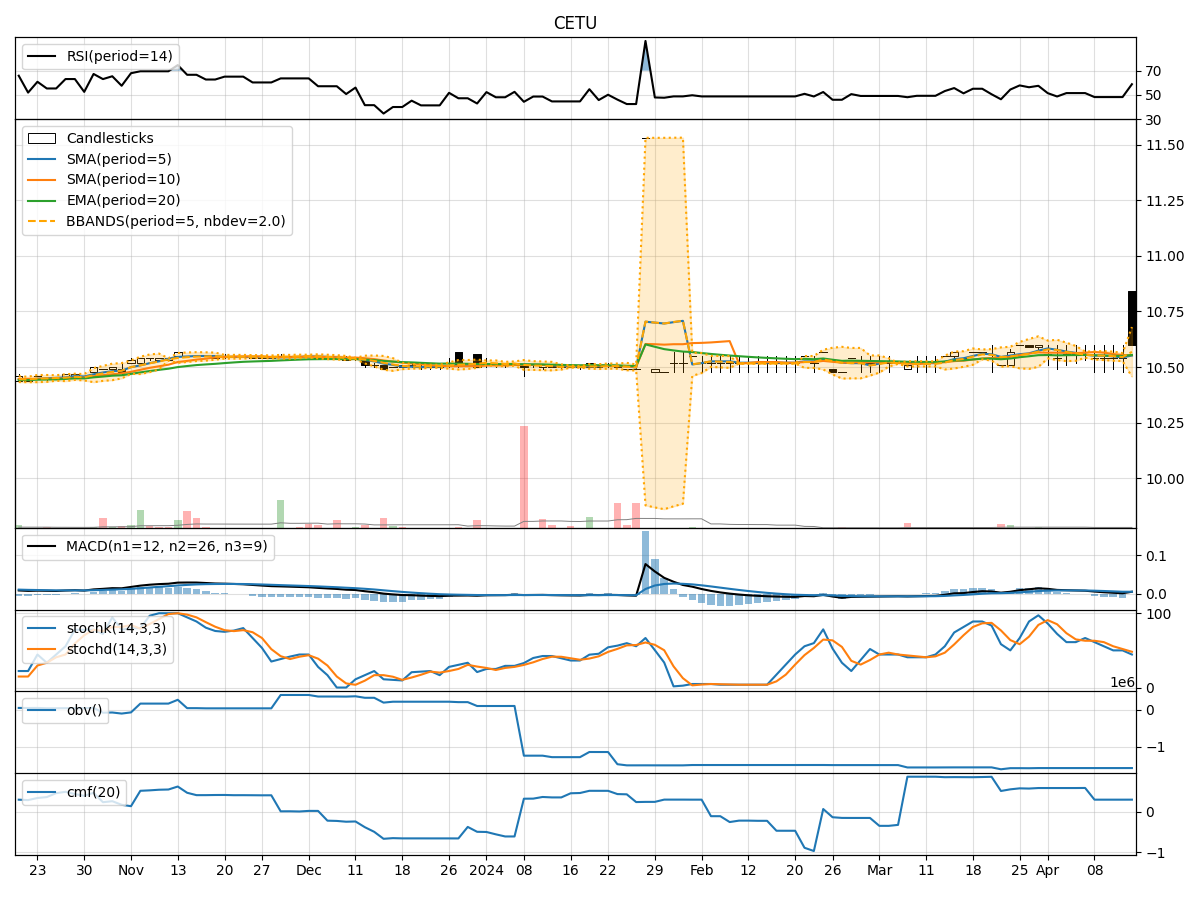
In analyzing the technical indicators for CETU over the last 5 days, we will delve into the trend, momentum, volatility, and volume indicators to provide a comprehensive outlook on the possible stock price movement. By examining these key aspects, we aim to offer valuable insights and predictions for the upcoming days.
Trend Indicators:
- Moving Averages (MA): The 5-day Moving Average (MA) has been hovering around the closing price, indicating a relatively stable trend.
- MACD: The Moving Average Convergence Divergence (MACD) has shown a slight positive trend, albeit with decreasing momentum.
- RSI: The Relative Strength Index (RSI) has been fluctuating around the neutral zone, suggesting a lack of strong directional bias.
Momentum Indicators:
- Stochastic Oscillator: The Stochastic Oscillator reflects a mixed sentiment with oscillations in the oversold and neutral zones.
- Williams %R: The Williams %R indicator has consistently shown oversold conditions, indicating a potential reversal.
Volatility Indicators:
- Bollinger Bands: The Bollinger Bands have narrowed, indicating decreased volatility and a potential breakout in the near future.
Volume Indicators:
- On-Balance Volume (OBV): The OBV has remained relatively flat, suggesting a lack of significant buying or selling pressure.
- Chaikin Money Flow (CMF): The CMF has been negative, indicating a bearish money flow trend.
Key Observations:
- The stock has been trading in a tight range with minimal price movements.
- Momentum indicators suggest a lack of strong buying or selling pressure.
- Volatility has decreased, signaling a potential period of consolidation.
- Volume indicators indicate a neutral stance with no significant accumulation or distribution.
Conclusion:
Based on the analysis of the technical indicators, the stock is likely to continue trading sideways in the near term. The lack of clear trends in both price and momentum, coupled with low volatility and neutral volume signals, indicates a period of consolidation. Traders may expect the stock to remain range-bound with limited upside or downside potential. It is advisable to wait for a breakout or a clearer trend confirmation before considering any significant trading decisions.
Recommendation:
- Short-term Traders: Consider staying on the sidelines until a clear trend emerges.
- Long-term Investors: Monitor the stock for potential entry points during a breakout from the current consolidation phase.
- Risk Management: Implement tight stop-loss orders to protect positions in case of unexpected price movements.
By carefully monitoring the evolving market dynamics and being prepared to adapt to changing conditions, investors can position themselves strategically to capitalize on future price movements.