Technical Analysis of CERT 2024-05-31
Overview:
In analyzing the technical indicators for CERT over the last 5 days, we will delve into the trend, momentum, volatility, and volume indicators to provide a comprehensive outlook on the possible stock price movement in the coming days. By examining these key aspects, we aim to offer valuable insights and predictions for investors looking to make informed decisions.
Trend Analysis:
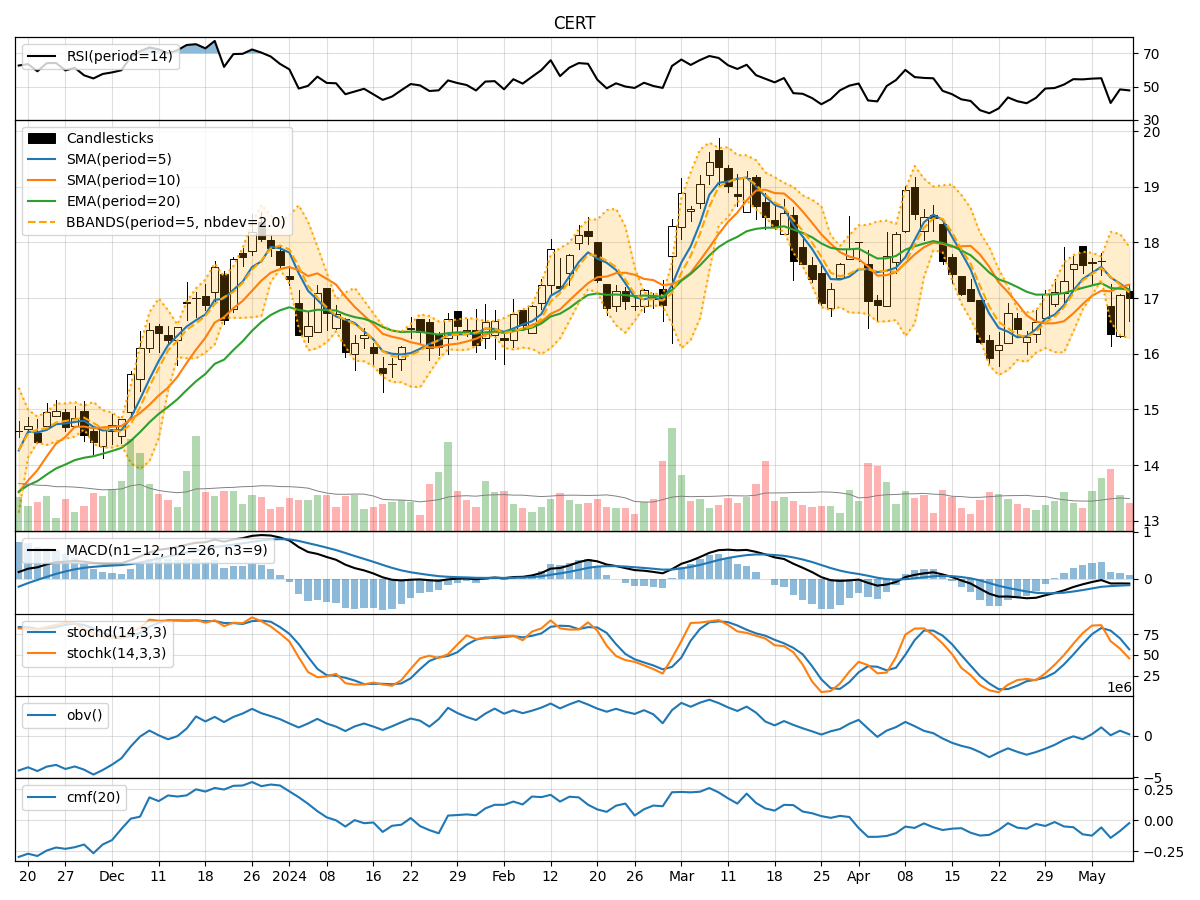
- Moving Averages (MA): The 5-day Moving Average (MA) has been fluctuating around the closing prices, indicating short-term price trends. The Simple Moving Average (SMA) and Exponential Moving Average (EMA) show a mixed trend with slight variations.
- Moving Average Convergence Divergence (MACD): The MACD and Signal Line (macdh) have been consistently negative, suggesting a bearish momentum in the short term.
Momentum Analysis:
- Relative Strength Index (RSI): The RSI values have been hovering around the mid-range, indicating a neutral sentiment in the market.
- Stochastic Oscillator: Both %K and %D values have been increasing, showing a bullish momentum in the recent days.
- Williams %R (Willams %R): The Williams %R is in the oversold territory, suggesting a potential reversal in the stock price.
Volatility Analysis:
- Bollinger Bands (BB): The Bollinger Bands have been narrowing, indicating decreasing volatility in the stock price.
- Bollinger Band %B (BB %B): The %B value has been fluctuating around the mid-range, reflecting a consolidation phase in the stock.
Volume Analysis:
- On-Balance Volume (OBV): The OBV has shown mixed movements, indicating indecision among investors regarding the stock.
- Chaikin Money Flow (CMF): The CMF has been relatively low, suggesting a lack of strong buying or selling pressure in the market.
Conclusion:
Based on the analysis of the technical indicators, the stock of CERT is currently exhibiting mixed signals. While the momentum indicators like Stochastic Oscillator show a bullish sentiment, the trend indicators such as MACD signal a bearish outlook. The volatility has been decreasing, indicating a potential consolidation phase, while the volume indicators reflect indecision among market participants.
Overall Assessment:
- Trend: Neutral to Bearish
- Momentum: Bullish
- Volatility: Consolidation
- Volume: Indecisive
Forecast:
Considering the conflicting signals from the technical indicators, it is likely that CERT may experience a period of consolidation in the near term. Investors should closely monitor key support and resistance levels for potential breakout or breakdown scenarios. It is advisable to wait for clearer signals or confirmation from multiple indicators before making significant trading decisions.
Key Takeaway:
Maintain a cautious approach and wait for more definitive signals to emerge before taking a decisive stance on the stock. Market dynamics can change rapidly, so staying informed and adaptable is crucial in navigating uncertain market conditions.