Technical Analysis of CDRO 2024-05-10
Overview:
In analyzing the technical indicators for CDRO over the last 5 days, we will delve into the trend, momentum, volatility, and volume indicators to provide a comprehensive outlook on the possible stock price movement in the coming days. By examining these key indicators, we aim to offer valuable insights and predictions to guide investment decisions.
Trend Analysis:
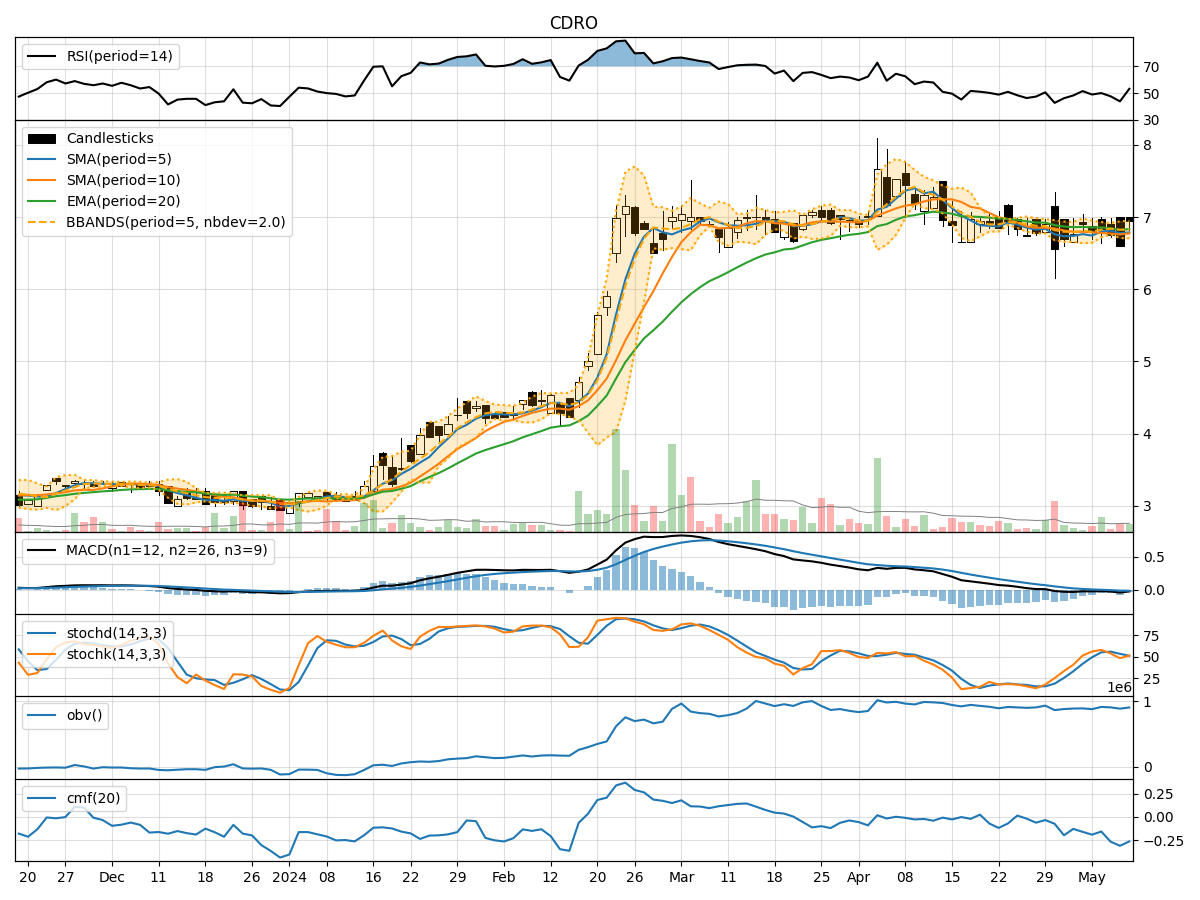
- Moving Averages (MA): The 5-day Moving Average (MA) has been fluctuating around the closing prices, indicating short-term price trends. The Simple Moving Average (SMA) and Exponential Moving Average (EMA) show a slight downward trend, suggesting a potential bearish sentiment.
- MACD: The Moving Average Convergence Divergence (MACD) has been negative, with the MACD line below the signal line. This indicates a bearish momentum in the stock price.
Momentum Analysis:
- RSI: The Relative Strength Index (RSI) has been hovering around the neutral zone, indicating a lack of strong momentum in either direction.
- Stochastic Oscillator: Both %K and %D values of the Stochastic Oscillator are below 50, suggesting a bearish momentum in the stock.
Volatility Analysis:
- Bollinger Bands (BB): The Bollinger Bands have been narrowing, indicating decreasing volatility in the stock price. The bands are currently close to each other, suggesting a potential breakout in either direction.
Volume Analysis:
- On-Balance Volume (OBV): The OBV has been relatively stable, indicating a balance between buying and selling pressure. However, the cumulative Money Flow (CMF) is negative, signaling a bearish sentiment in the stock.
Key Observations:
- The trend indicators show a bearish sentiment with moving averages pointing downwards and a negative MACD.
- Momentum indicators also support a bearish view with RSI in the neutral zone and Stochastic Oscillator signaling bearish momentum.
- Volatility is decreasing, indicating a potential consolidation phase before a breakout.
- Volume indicators suggest a balance between buying and selling pressure, but the negative CMF hints at a bearish outlook.
Conclusion:
Based on the analysis of the technical indicators, the stock price of CDRO is likely to experience a downward movement in the coming days. The bearish trend, negative momentum, and decreasing volatility point towards a potential decline in the stock price. Traders and investors should exercise caution and consider shorting or selling positions to capitalize on the expected downward movement. It is advisable to closely monitor the price action and key support levels for confirmation of the bearish trend.