Technical Analysis of CCEP 2024-05-10
Overview:
In analyzing the technical indicators for CCEP over the last 5 days, we will delve into the trend, momentum, volatility, and volume indicators to provide a comprehensive outlook on the possible stock price movement in the coming days. By examining these key aspects, we aim to offer valuable insights and predictions to guide your investment decisions.
Trend Indicators:
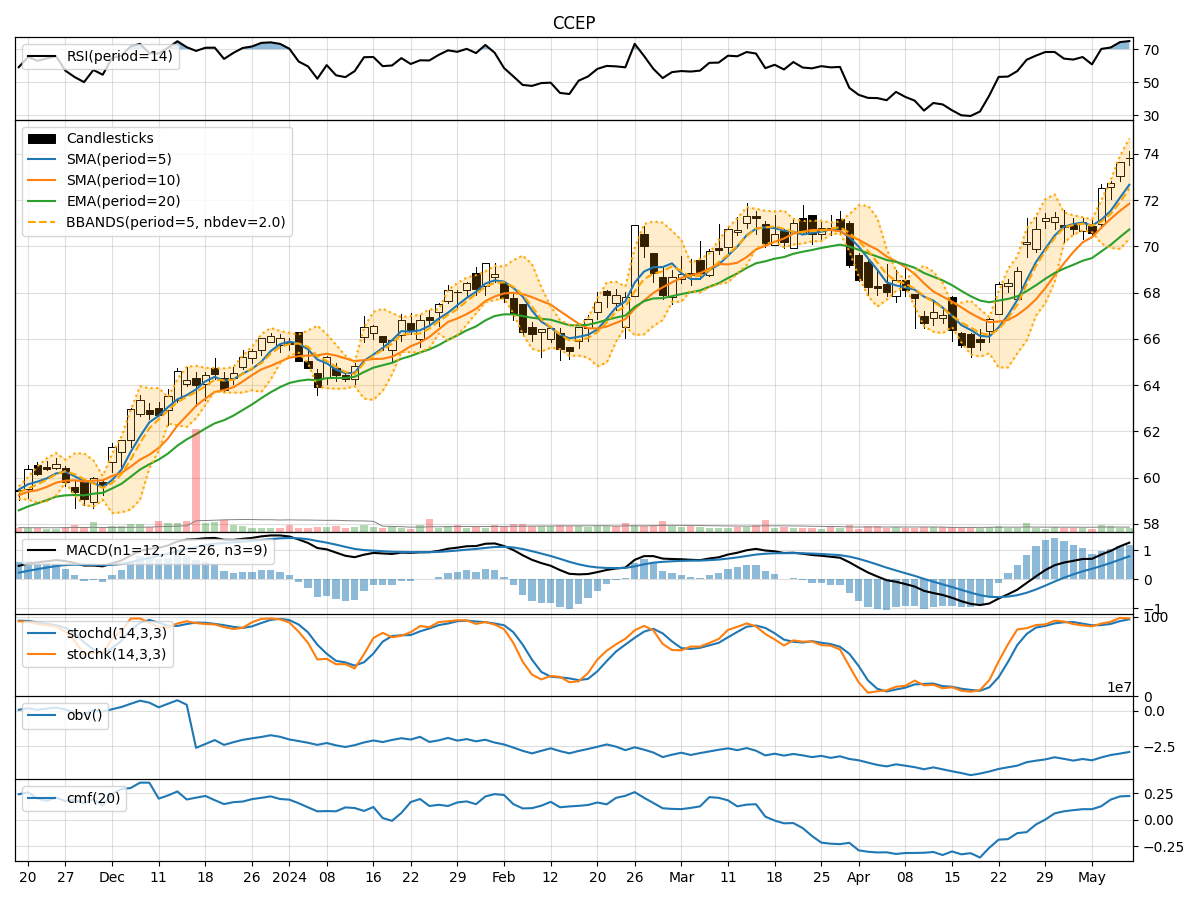
- Moving Averages (MA): The 5-day MA has been consistently above the closing prices, indicating a bullish trend.
- MACD: The MACD line has been above the signal line, suggesting a bullish momentum.
- EMA: The EMA has been steadily increasing, supporting the bullish trend.
Momentum Indicators:
- RSI: The RSI has been trending upwards, indicating increasing buying pressure.
- Stochastic Oscillator: Both %K and %D have been in overbought territory, signaling a strong bullish momentum.
- Williams %R: The indicator has been in oversold territory, suggesting a potential reversal.
Volatility Indicators:
- Bollinger Bands: The stock price has been trading near the upper Bollinger Band, indicating high volatility.
- Bollinger %B: The %B value has been above 0.8, signifying an overbought condition.
Volume Indicators:
- On-Balance Volume (OBV): The OBV has shown mixed signals, with some days experiencing selling pressure and others showing accumulation.
- Chaikin Money Flow (CMF): The CMF has been positive, indicating buying pressure in the stock.
Key Observations:
- The trend indicators suggest a strong bullish sentiment in the stock.
- Momentum indicators point towards a continuation of the bullish momentum.
- Volatility indicators indicate high volatility, potentially leading to sharp price movements.
- Volume indicators show a mix of buying and selling pressure, with a slight bias towards accumulation.
Conclusion:
Based on the analysis of the technical indicators, the next few days are likely to see a continuation of the upward trend in CCEP stock price. The bullish momentum is supported by the moving averages, MACD, RSI, and Stochastic Oscillator. However, investors should be cautious of the high volatility indicated by the Bollinger Bands and %B values. Overall, the outlook for CCEP appears bullish in the short term.