Technical Analysis of CASI 2024-05-10
Overview:
In analyzing the technical indicators for CASI over the last 5 days, we will delve into the trend, momentum, volatility, and volume indicators to provide a comprehensive outlook on the possible stock price movement in the coming days. By examining these key aspects, we aim to offer valuable insights and predictions for potential investors.
Trend Indicators:
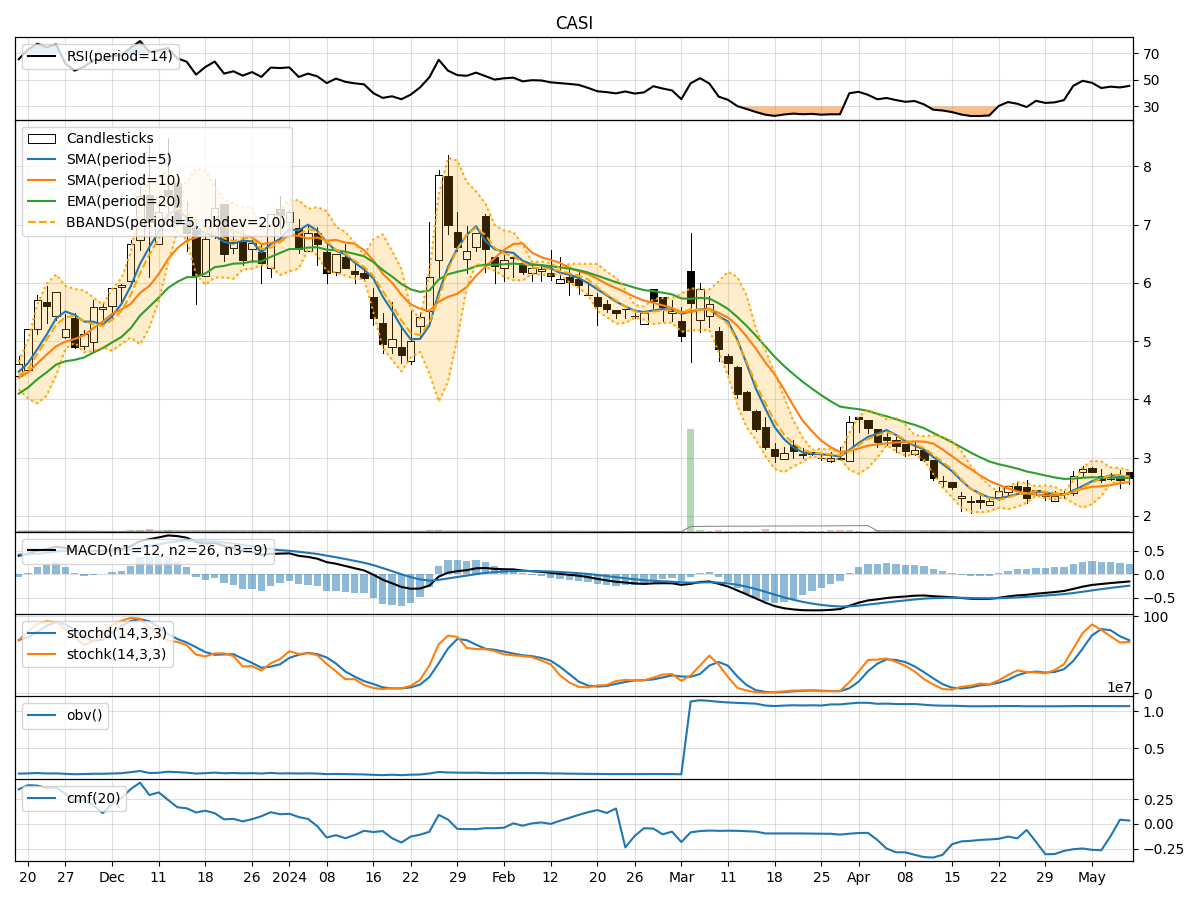
- Moving Averages (MA): The 5-day Moving Average (MA) has been fluctuating around the closing prices, indicating short-term price trends.
- MACD: The Moving Average Convergence Divergence (MACD) has been negative, suggesting a bearish momentum in the stock.
- EMA: The Exponential Moving Average (EMA) has been slightly declining, reflecting a weakening trend.
Momentum Indicators:
- RSI: The Relative Strength Index (RSI) has been hovering around the neutral zone, indicating a lack of strong momentum.
- Stochastic Oscillator: Both %K and %D have been declining, signaling a potential bearish momentum.
- Williams %R: The Williams %R has been fluctuating in the oversold territory, suggesting a possible reversal.
Volatility Indicators:
- Bollinger Bands (BB): The Bollinger Bands have been narrowing, indicating decreasing volatility in the stock.
- BB% (Bollinger Band %B): The %B has been relatively stable, suggesting a consolidation phase.
- BBW (Bollinger Band Width): The Band Width has been decreasing, indicating reduced price volatility.
Volume Indicators:
- On-Balance Volume (OBV): The OBV has shown mixed signals, reflecting indecision among market participants.
- Chaikin Money Flow (CMF): The CMF has been negative, indicating selling pressure in the stock.
Key Observations:
- The trend indicators suggest a bearish sentiment with negative MACD and declining EMA.
- Momentum indicators show a lack of strong buying interest with RSI in the neutral zone and stochastic indicators pointing downwards.
- Volatility indicators indicate decreasing price volatility and a potential consolidation phase.
- Volume indicators reflect mixed signals with OBV showing indecision and CMF indicating selling pressure.
Conclusion:
Based on the analysis of the technical indicators, the stock price of CASI is likely to experience further downward movement in the coming days. The bearish trend, lack of strong momentum, decreasing volatility, and mixed volume signals all point towards a bearish outlook for CASI. Investors should exercise caution and consider waiting for more positive signals before considering any long positions.