Technical Analysis of CAPT 2024-05-10
Overview:
In analyzing the technical indicators for CAPT over the last 5 days, we will delve into the trend, momentum, volatility, and volume indicators to provide a comprehensive assessment of the stock's potential price movement. By examining these key factors, we aim to offer valuable insights and predictions for the next few days.
Trend Analysis:
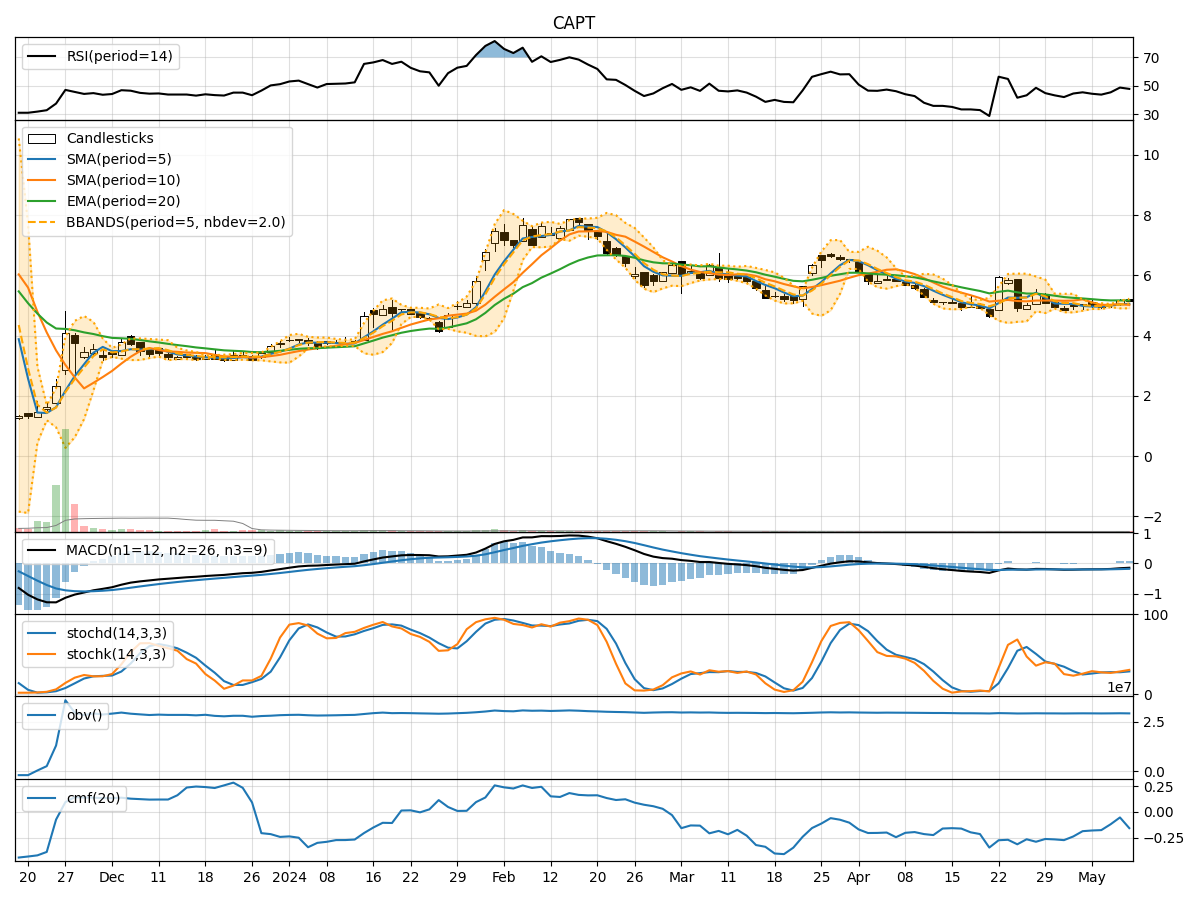
- Moving Averages (MA): The 5-day MA has been fluctuating around the closing prices, indicating short-term price trends. The SMA(10) and EMA(20) show a downward trend, suggesting a bearish sentiment.
- MACD: The MACD line has been consistently below the signal line, indicating a bearish trend. However, the MACD histogram has shown slight improvement over the last few days.
Momentum Analysis:
- RSI: The RSI has been gradually increasing, indicating a potential bullish momentum building up.
- Stochastic Oscillator: Both %K and %D have been rising, suggesting an upward momentum in the stock price.
- Williams %R: The Williams %R is in the oversold territory, indicating a potential reversal in the stock price.
Volatility Analysis:
- Bollinger Bands (BB): The stock price has been trading within the bands, with the %B indicating a neutral position. The narrowing of the bands suggests a potential breakout in the near future.
- Average True Range (ATR): The ATR has been relatively stable, indicating consistent price movements without significant volatility spikes.
Volume Analysis:
- On-Balance Volume (OBV): The OBV has been declining, suggesting selling pressure in the stock.
- Chaikin Money Flow (CMF): The CMF has been negative, indicating a bearish money flow in the stock.
Key Observations:
- The trend indicators point towards a bearish sentiment in the short term.
- Momentum indicators show a potential bullish momentum building up.
- Volatility indicators suggest a potential breakout in the near future.
- Volume indicators indicate selling pressure and bearish money flow.
Conclusion:
Based on the analysis of the technical indicators, the next few days' possible stock price movement for CAPT could be sideways with a slight bullish bias. While the trend indicators signal a bearish sentiment, the momentum indicators suggest a potential bullish momentum. The volatility indicators hint at a possible breakout, and the volume indicators indicate selling pressure. Therefore, investors should closely monitor the price action for any signs of a trend reversal or confirmation of the bullish momentum.