Technical Analysis of CACO 2024-05-10
Overview:
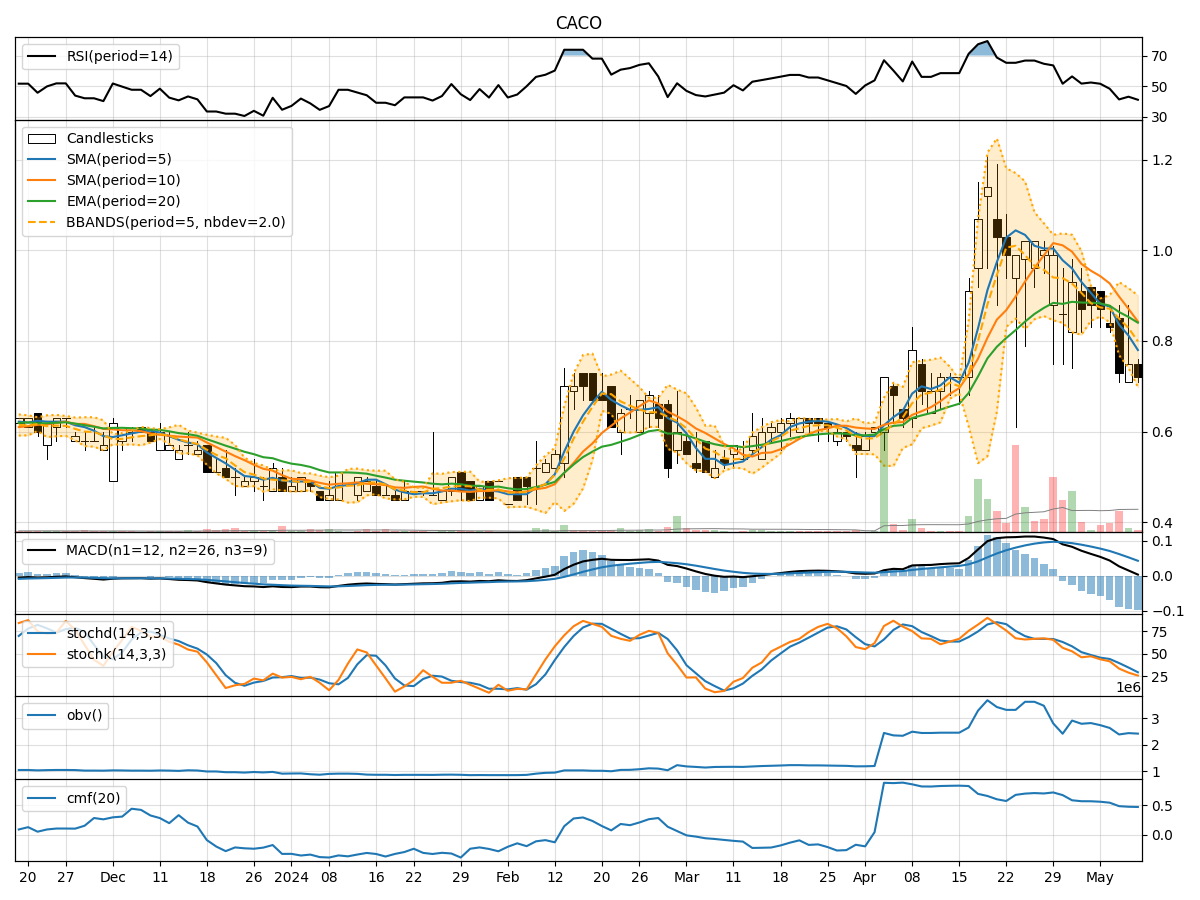
In analyzing the technical indicators for CACO over the last 5 days, we will delve into the trend, momentum, volatility, and volume indicators to provide a comprehensive outlook on the possible stock price movement. By examining these key factors, we aim to offer valuable insights and predictions for the upcoming trading days.
Trend Indicators:
- Moving Averages (MA): The 5-day MA has been consistently decreasing, indicating a downward trend in the stock price.
- MACD: The MACD line has been gradually decreasing, with the MACD histogram showing a bearish trend.
- Conclusion: The trend indicators suggest a strong bearish sentiment in the stock price movement.
Momentum Indicators:
- RSI: The RSI has been declining, indicating weakening momentum.
- Stochastic Oscillator: Both %K and %D have been decreasing, signaling a loss in momentum.
- Conclusion: Momentum indicators align with the trend, indicating a bearish momentum in the stock.
Volatility Indicators:
- Bollinger Bands: The bands have been narrowing, indicating decreasing volatility.
- Conclusion: Volatility is decreasing, suggesting a consolidation phase in the stock price.
Volume Indicators:
- On-Balance Volume (OBV): The OBV has been declining, indicating selling pressure.
- Chaikin Money Flow (CMF): The CMF has been decreasing, reflecting a decrease in buying pressure.
- Conclusion: Volume indicators support the bearish sentiment, indicating a bearish volume trend.
Conclusion:
Based on the analysis of trend, momentum, volatility, and volume indicators, the overall outlook for CACO stock suggests a strong bearish sentiment. The trend and momentum indicators both point towards a downward movement in the stock price, supported by decreasing volume and volatility. Therefore, the next few days are likely to see a continuation of the downward trend in CACO stock price. Investors should exercise caution and consider potential short-selling opportunities or wait for a more favorable entry point.