Technical Analysis of CAAS 2024-05-10
Overview:
In analyzing the technical indicators for CAAS over the last 5 days, we will delve into the trend, momentum, volatility, and volume indicators to provide a comprehensive outlook on the possible stock price movement. By examining these key aspects, we aim to offer valuable insights and predictions for the upcoming days.
Trend Analysis:
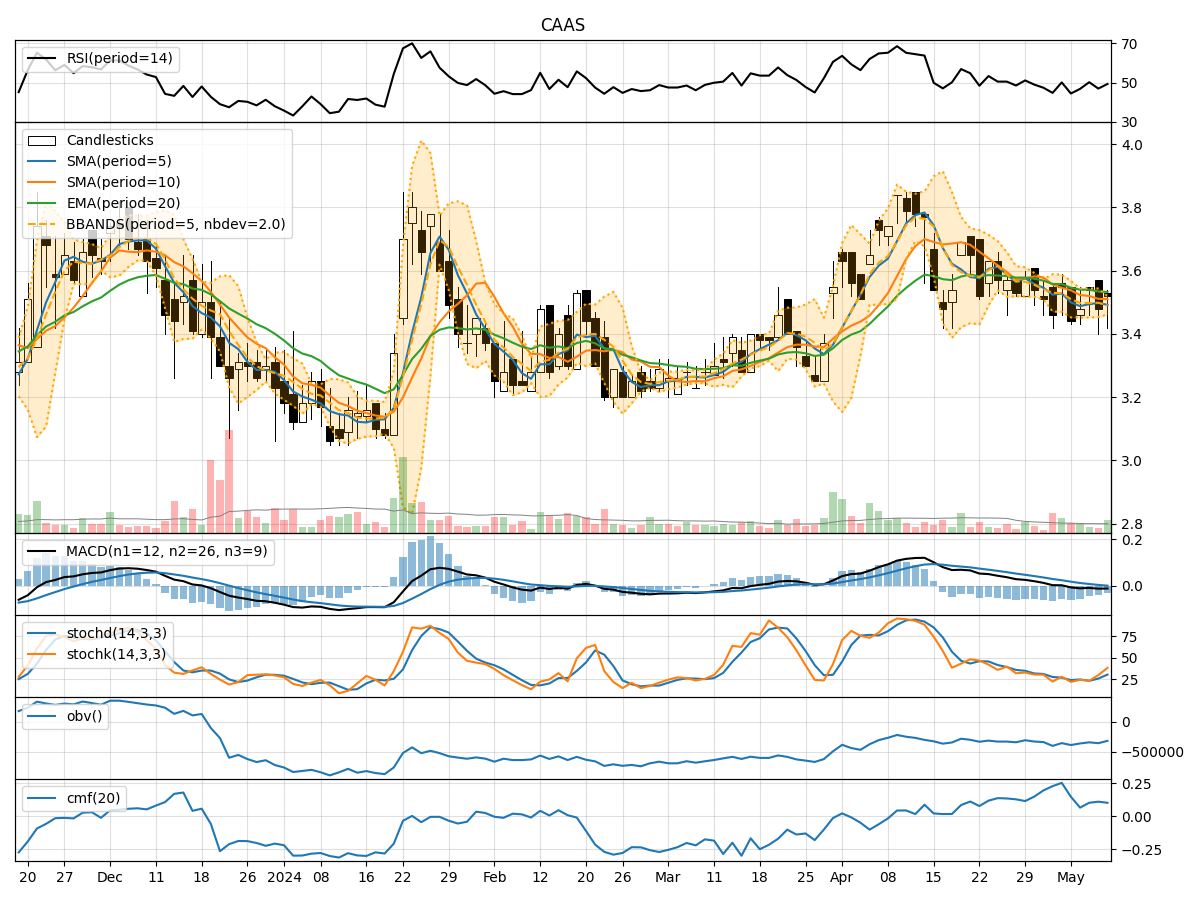
- Moving Averages (MA): The 5-day Moving Average (MA) has been fluctuating around the closing prices, indicating a lack of clear trend direction.
- MACD: The Moving Average Convergence Divergence (MACD) has been consistently negative, suggesting a bearish momentum in the short term.
- EMA: The Exponential Moving Average (EMA) has been slightly declining, further supporting the bearish sentiment.
Momentum Analysis:
- RSI: The Relative Strength Index (RSI) has been hovering around the mid-range, indicating a neutral momentum.
- Stochastic Oscillator: Both %K and %D have shown some upward movement but remain in oversold territory, suggesting a potential reversal.
- Williams %R: The Williams %R is also in oversold territory, indicating a possible buying opportunity.
Volatility Analysis:
- Bollinger Bands: The Bollinger Bands have been narrowing, indicating decreasing volatility in the stock price.
- Bollinger %B: The %B indicator is below 1, suggesting the stock is trading below the lower Bollinger Band, potentially indicating an oversold condition.
Volume Analysis:
- On-Balance Volume (OBV): The OBV has shown mixed signals, with some days seeing positive volume accumulation and others showing distribution.
- Chaikin Money Flow (CMF): The CMF has been relatively stable, indicating a neutral flow of money into the stock.
Key Observations:
- The trend indicators suggest a bearish sentiment in the short term, supported by the negative MACD and declining EMA.
- Momentum indicators show a neutral stance with potential signs of a reversal in the oversold territory.
- Volatility has been decreasing, indicating a possible period of consolidation.
- Volume indicators are mixed, reflecting uncertainty in investor sentiment.
Conclusion:
Based on the analysis of the technical indicators, the stock price of CAAS is likely to experience further downward movement in the next few days. The bearish trend supported by the MACD and EMA, coupled with the oversold conditions in the momentum indicators, suggests a potential continuation of the current downward trajectory. Traders should exercise caution and consider short-term selling strategies until clearer bullish signals emerge in the technical analysis.