Technical Analysis of BZUN 2024-05-10
Overview:
In analyzing the technical indicators for BZUN over the last 5 days, we will delve into the trend, momentum, volatility, and volume indicators to provide a comprehensive outlook on the possible stock price movement in the coming days.
Trend Analysis:
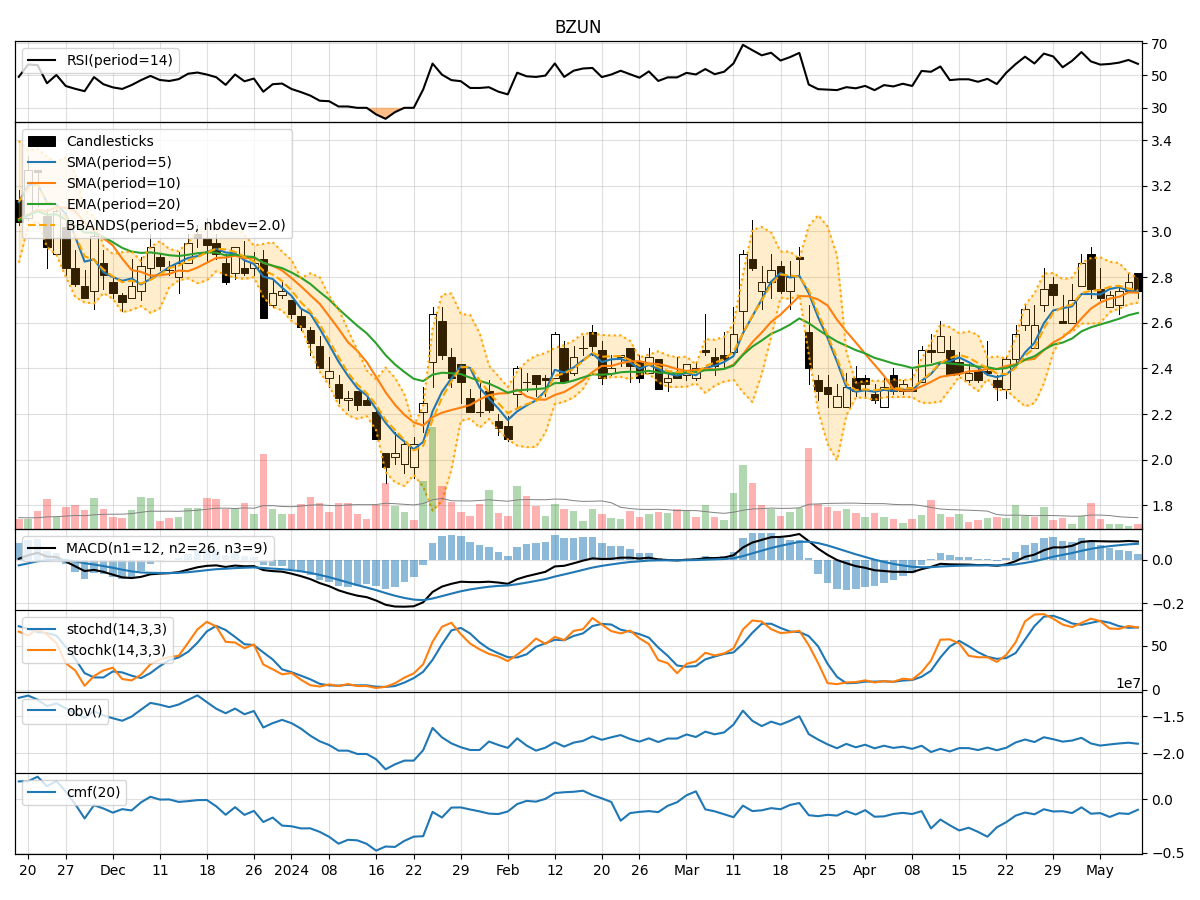
- Moving Averages (MA): The 5-day Moving Average (MA) has been fluctuating around the closing prices, indicating short-term price trends. The Simple Moving Average (SMA) and Exponential Moving Average (EMA) show an overall uptrend.
- MACD: The Moving Average Convergence Divergence (MACD) and its signal line have been positive, suggesting bullish momentum.
Key Observation: The trend indicators suggest a bullish sentiment in the short term.
Momentum Analysis:
- RSI: The Relative Strength Index (RSI) has been hovering around 50-60, indicating moderate momentum.
- Stochastic Oscillator: Both %K and %D have been fluctuating, showing mixed momentum signals.
- Williams %R: The Williams %R is in the oversold territory, indicating a potential reversal.
Key Observation: The momentum indicators suggest a neutral to slightly bullish momentum.
Volatility Analysis:
- Bollinger Bands (BB): The Bollinger Bands have been narrowing, indicating decreasing volatility.
Key Observation: The volatility indicators suggest a decreasing volatility in the stock.
Volume Analysis:
- On-Balance Volume (OBV): The OBV has been fluctuating, indicating mixed buying and selling pressure.
- Chaikin Money Flow (CMF): The CMF has been negative, suggesting outflow of money from the stock.
Key Observation: The volume indicators suggest a mixed sentiment with a slight bearish bias.
Conclusion:
Based on the analysis of the technical indicators, the overall outlook for BZUN in the next few days is as follows: - Trend: Upward trend based on moving averages and MACD. - Momentum: Neutral to slightly bullish momentum based on RSI and Stochastic Oscillator. - Volatility: Decreasing volatility based on Bollinger Bands. - Volume: Mixed sentiment with a slight bearish bias based on OBV and CMF.
Overall Assessment:
Considering the technical indicators collectively, the stock is likely to experience upward movement in the next few days, supported by the bullish trend and momentum. However, the mixed volume signals and decreasing volatility suggest a cautious approach. Traders may consider entering long positions with proper risk management strategies in place.
Key Takeaway:
- Bullish Bias: The stock is poised for upward movement.
- Caution: Mixed volume signals and decreasing volatility warrant careful monitoring.
- Risk Management: Implement appropriate risk management strategies to navigate potential fluctuations.
By combining insights from trend, momentum, volatility, and volume indicators, traders can make informed decisions aligned with the current market dynamics.