Technical Analysis of BYNO 2024-05-10
Overview:
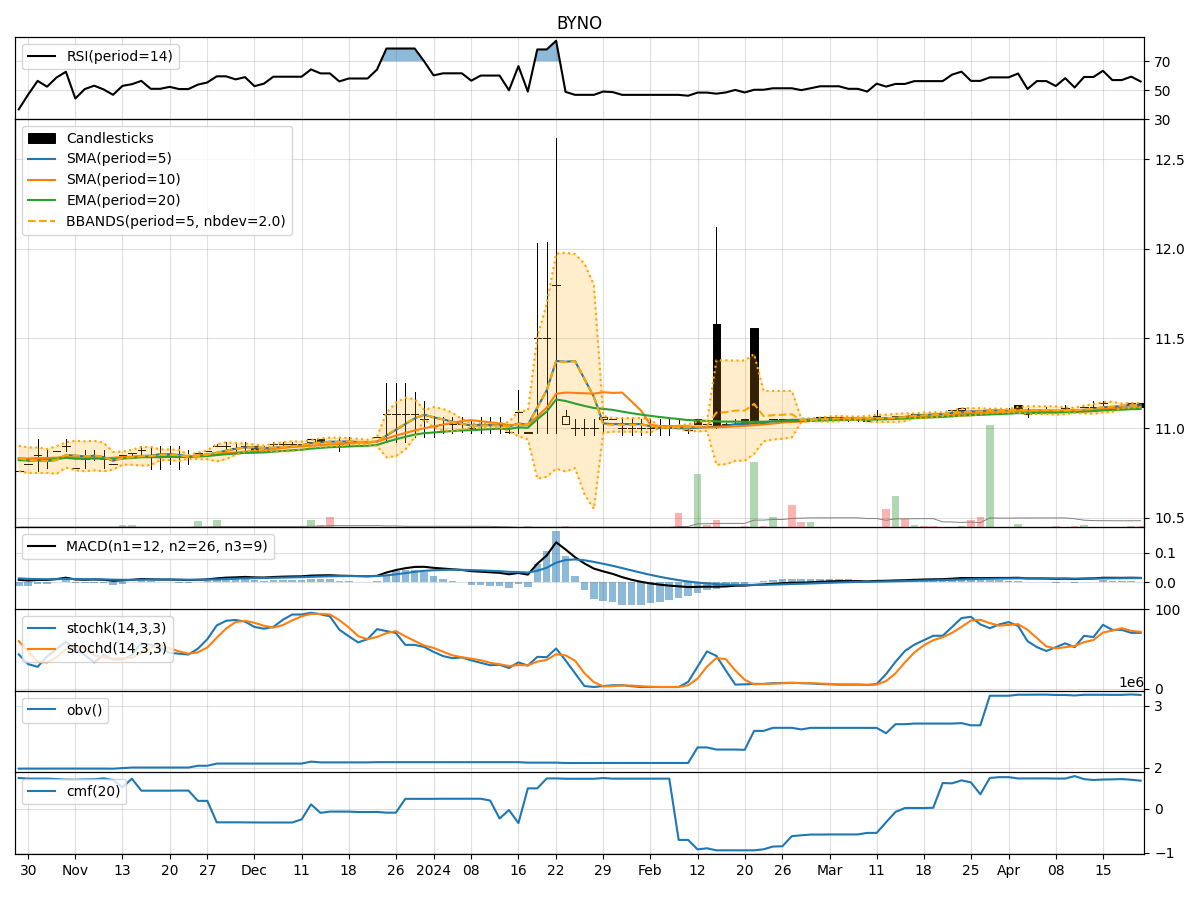
In analyzing the technical indicators for BYNO stock over the last 5 days, we will delve into the trends, momentum, volatility, and volume aspects to provide a comprehensive outlook on the possible stock price movement in the coming days. By examining key indicators such as moving averages, MACD, RSI, Bollinger Bands, and OBV, we aim to offer valuable insights and predictions for potential investors.
Trend Analysis:
- Moving Averages (MA): The 5-day MA has been relatively stable around the closing price, indicating a neutral trend.
- MACD: The MACD line has been consistently positive, suggesting a bullish momentum.
Momentum Analysis:
- RSI: The RSI has been fluctuating around the 60 level, indicating moderate momentum.
- Stochastic Oscillator: The Stochastic indicators show a slight increase in momentum but are not in overbought territory.
Volatility Analysis:
- Bollinger Bands: The Bollinger Bands have remained relatively narrow, suggesting low volatility.
Volume Analysis:
- On-Balance Volume (OBV): The OBV has been relatively flat, indicating stable buying pressure.
- Chaikin Money Flow (CMF): The CMF has shown a slight increase, indicating potential accumulation.
Key Observations:
- The stock is currently in a consolidation phase with stable trends, moderate momentum, low volatility, and steady volume.
- The MACD and RSI suggest a slight bullish bias, while the Stochastic indicators show a potential for increased momentum.
- The Bollinger Bands indicate a lack of significant price movement in the near term.
- The OBV and CMF suggest moderate buying interest and accumulation by investors.
Conclusion:
Based on the analysis of the technical indicators, the next few days for BYNO stock are likely to see sideways movement with a slight bullish bias. Investors can expect the stock price to remain relatively stable with potential for a modest uptrend. It is advisable to closely monitor the momentum indicators for any signs of a stronger bullish trend. Overall, a cautious approach with a focus on key support and resistance levels is recommended for trading or investment decisions.