Technical Analysis of BWAY 2024-05-10
Overview:
In analyzing the technical indicators for BWAY stock over the last 5 days, we will delve into the trend, momentum, volatility, and volume indicators to provide a comprehensive outlook on the possible future stock price movement. By examining these key indicators, we aim to offer valuable insights and predictions for the upcoming trading days.
Trend Analysis:
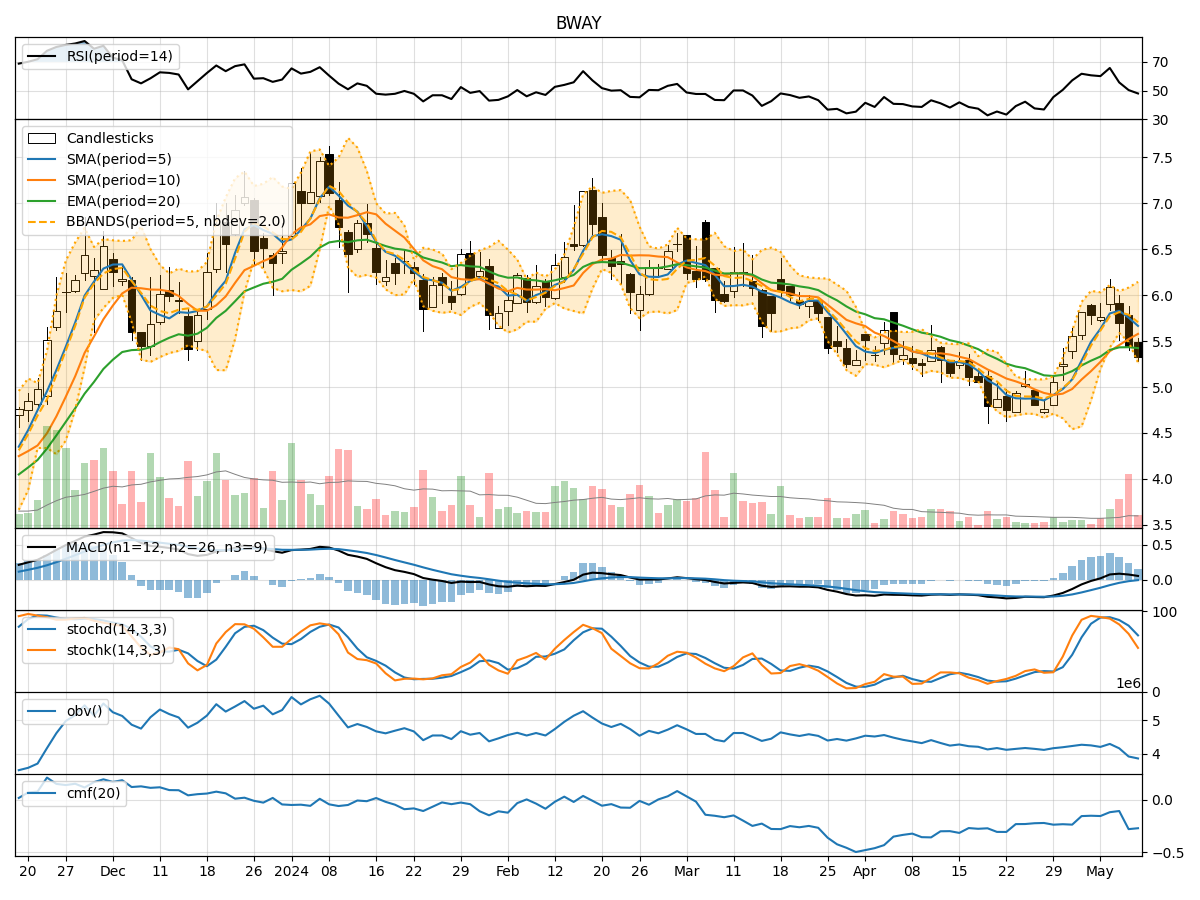
- Moving Averages (MA): The 5-day Moving Average (MA) has been fluctuating around the closing prices, indicating short-term price trends. The Simple Moving Average (SMA) and Exponential Moving Average (EMA) show a slight upward trend, suggesting potential bullish momentum.
- MACD: The Moving Average Convergence Divergence (MACD) has been positive, with the MACD line consistently above the signal line. This signals a bullish trend in the stock price.
- Conclusion: The trend indicators suggest a bullish outlook for BWAY stock in the near term.
Momentum Analysis:
- RSI: The Relative Strength Index (RSI) has been hovering around 50, indicating a neutral momentum in the stock price.
- Stochastic Oscillator: Both %K and %D levels of the Stochastic Oscillator have been declining, pointing towards a potential reversal in momentum to the downside.
- Conclusion: The momentum indicators suggest a neutral to slightly bearish momentum for BWAY stock.
Volatility Analysis:
- Bollinger Bands (BB): The Bollinger Bands have been narrowing, indicating decreasing volatility in the stock price. The bands are currently close to each other, suggesting a potential breakout or significant price movement.
- Conclusion: The volatility indicators suggest a potential breakout or significant price movement in the near future.
Volume Analysis:
- On-Balance Volume (OBV): The OBV has been consistently negative, indicating selling pressure in the stock.
- Chaikin Money Flow (CMF): The CMF has been negative, reflecting a lack of buying interest in the stock.
- Conclusion: The volume indicators suggest bearish sentiment and lack of strong buying interest in BWAY stock.
Overall Conclusion:
Based on the analysis of trend, momentum, volatility, and volume indicators, the overall outlook for BWAY stock in the next few days is as follows: - Trend: Upward trend indicated by moving averages and MACD. - Momentum: Neutral to slightly bearish momentum suggested by RSI and Stochastic Oscillator. - Volatility: Potential breakout or significant price movement anticipated due to narrowing Bollinger Bands. - Volume: Bearish sentiment and lack of strong buying interest indicated by OBV and CMF.
Recommendation:
Considering the mixed signals from the technical indicators, investors should proceed with caution. It is advisable to closely monitor the price action and wait for confirmation of a clear trend before making any significant trading decisions. Traders may consider setting stop-loss orders to manage risk effectively in the current market environment.
Disclaimer:
This analysis is based solely on technical indicators and historical data, and it is essential to consider other fundamental factors and market dynamics before making investment decisions. It is recommended to consult with a financial advisor for personalized advice tailored to individual investment goals and risk tolerance levels.