Technical Analysis of BRSH 2024-05-10
Overview:
In analyzing the technical indicators for BRSH over the last 5 days, we will delve into the trend, momentum, volatility, and volume indicators to provide a comprehensive assessment of the stock's potential price movement. By examining these key factors, we aim to offer valuable insights and predictions for the next few days.
Trend Analysis:
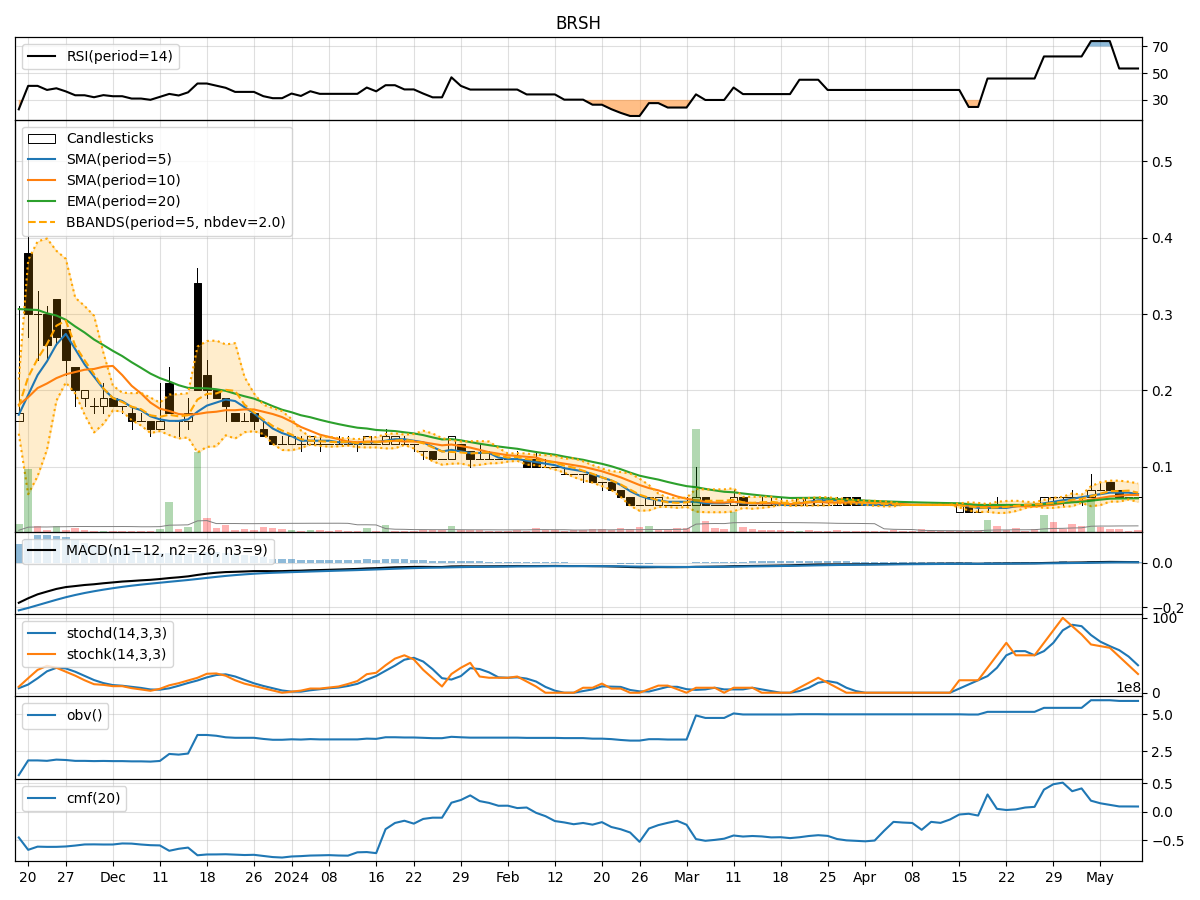
- Moving Averages (MA): The 5-day Moving Average (MA) has been fluctuating around the 0.064 level, indicating a relatively stable trend in the short term.
- MACD: The Moving Average Convergence Divergence (MACD) has shown a slight decrease in momentum but remains positive, suggesting a potential slowdown in the uptrend.
- EMA: The Exponential Moving Average (EMA) has been gradually increasing, reflecting a positive trend in the stock price.
Key Observation: The trend indicators suggest a neutral to slightly bullish outlook for BRSH in the short term.
Momentum Analysis:
- RSI: The Relative Strength Index (RSI) has been consistently above 50, indicating bullish momentum in the stock.
- Stochastic Oscillator: Both %K and %D values have been declining, signaling a potential weakening of the bullish momentum.
- Williams %R: The Williams %R indicator has been consistently in the oversold territory, suggesting a possible reversal in the near future.
Key Observation: Momentum indicators show a mixed signal with a slight bearish bias in the short term.
Volatility Analysis:
- Bollinger Bands: The Bollinger Bands have remained relatively stable, indicating a lack of significant price volatility.
- Bollinger %B: The %B value has fluctuated within a narrow range, suggesting a period of consolidation.
- Average True Range (ATR): The ATR value has been relatively low, indicating low volatility in the stock.
Key Observation: Volatility indicators point towards a period of consolidation and low volatility in the stock.
Volume Analysis:
- On-Balance Volume (OBV): The OBV has shown a slight decrease, indicating a potential distribution phase.
- Chaikin Money Flow (CMF): The CMF has been declining, suggesting a decrease in buying pressure.
Key Observation: Volume indicators suggest a weakening of buying pressure and a potential shift in market sentiment.
Conclusion:
Based on the analysis of trend, momentum, volatility, and volume indicators, the next few days for BRSH are likely to see sideways movement with a slight bearish bias. The trend remains relatively stable, but momentum indicators show signs of weakness. Volatility is low, indicating a period of consolidation, while volume indicators suggest a decrease in buying pressure.
Key Conclusion: The stock is expected to trade within a narrow range in the near term, with a potential downside bias. Traders should exercise caution and closely monitor key support levels for any potential breakdown.