Technical Analysis of BRNS 2024-05-10
Overview:
In analyzing the technical indicators for BRNS over the last 5 days, we will delve into the trend, momentum, volatility, and volume indicators to provide a comprehensive assessment of the stock's potential price movement. By examining these key factors, we aim to offer valuable insights and predictions for the next few days.
Trend Analysis:
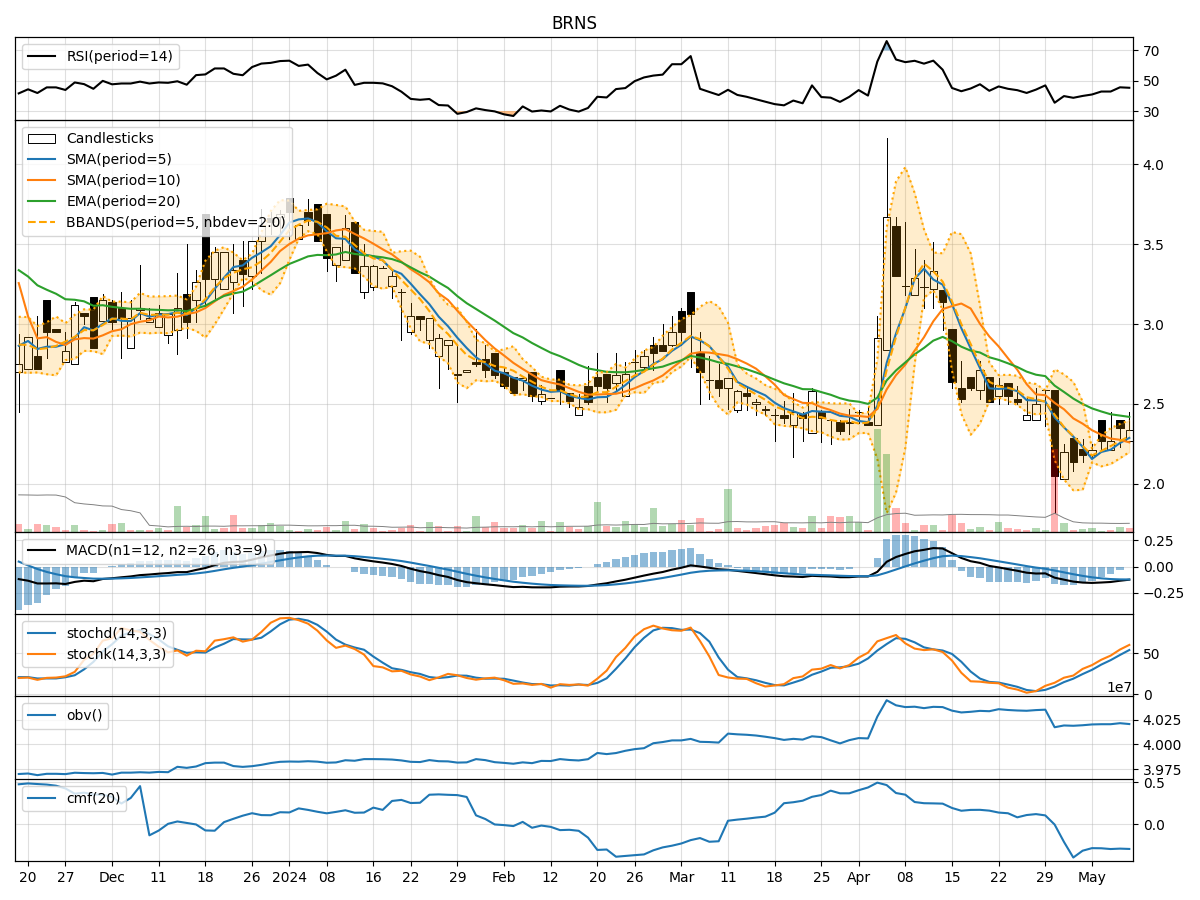
- Moving Averages (MA): The 5-day MA has been fluctuating around the closing prices, indicating short-term price trends. The stock has been trading below both the 10-day SMA and the 20-day EMA, suggesting a bearish sentiment.
- MACD: The MACD line has been consistently negative, with the MACD histogram showing a slight decrease over the past few days. This indicates a weakening bearish momentum in the stock.
Momentum Analysis:
- RSI: The RSI has been hovering around the mid-range, indicating a neutral sentiment in terms of momentum. There is no clear overbought or oversold signal.
- Stochastic Oscillator: Both %K and %D lines of the Stochastic Oscillator have been trending upwards, suggesting a potential bullish momentum building up.
- Williams %R: The Williams %R is also showing signs of improvement, moving towards a less oversold territory.
Volatility Analysis:
- Bollinger Bands (BB): The stock price has been trading within the Bollinger Bands, with the bands narrowing slightly over the last few days. This could indicate a period of consolidation or reduced volatility.
- Bollinger %B: The %B indicator is below 1, suggesting that the stock is trading below the lower Bollinger Band, potentially indicating an oversold condition.
Volume Analysis:
- On-Balance Volume (OBV): The OBV has been relatively flat, indicating a balance between buying and selling pressure.
- Chaikin Money Flow (CMF): The CMF has been negative, reflecting a net outflow of money from the stock over the analyzed period.
Conclusion:
Based on the analysis of the technical indicators, the stock BRNS is currently exhibiting mixed signals. While the trend indicators suggest a bearish sentiment with the stock trading below key moving averages, the momentum indicators show a potential shift towards bullish momentum. The volatility indicators point towards a period of consolidation or reduced volatility, while the volume indicators indicate a balance between buying and selling pressure.
Overall Assessment:
Given the mixed signals from the technical indicators, it is challenging to provide a definitive prediction for the next few days. However, considering the potential bullish momentum building up from the momentum indicators, there could be a slight upward movement in the stock price in the near term. Traders and investors should closely monitor the price action and key levels to make informed decisions.
Key Takeaways:
- Trend: Bearish
- Momentum: Bullish
- Volatility: Consolidation
- Volume: Balanced
Recommendation:
Considering the potential bullish momentum, investors may cautiously consider long positions with proper risk management strategies in place. However, it is crucial to closely monitor the price action and key support/resistance levels for any signs of a trend reversal.