Technical Analysis of BRLS 2024-05-10
Overview:
In analyzing the technical indicators for BRLS over the last 5 days, we will delve into the trend, momentum, volatility, and volume indicators to provide a comprehensive outlook on the possible stock price movement. By examining these key aspects, we aim to offer valuable insights and predictions for the upcoming days.
Trend Analysis:
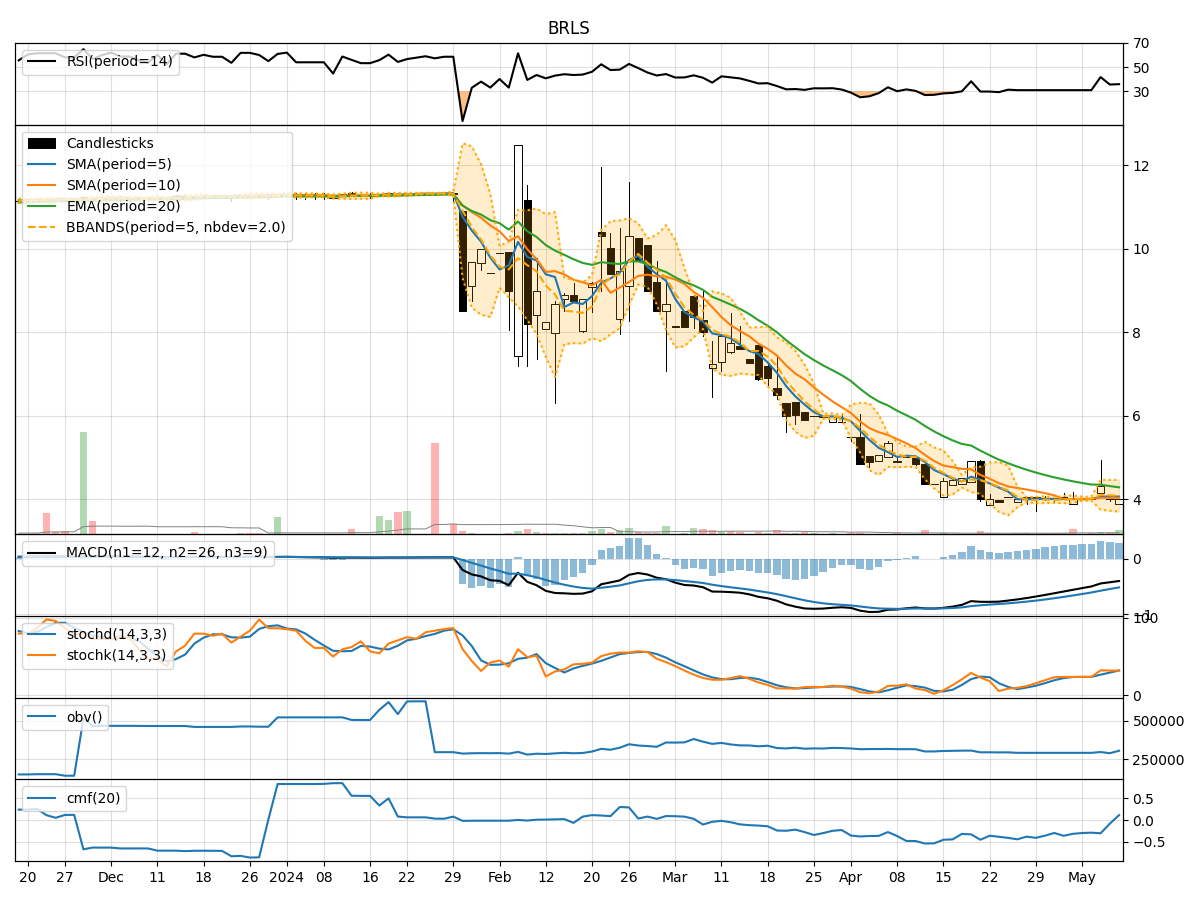
- Moving Averages (MA): The 5-day Moving Average (MA) has been relatively stable around the $4 mark, indicating a consistent price level.
- MACD and Signal Line: The MACD has been negative, suggesting a bearish momentum in the short term.
- EMA: The Exponential Moving Average (EMA) has been declining, reflecting a downward trend in the stock price.
Momentum Analysis:
- RSI: The Relative Strength Index (RSI) has been hovering around 30-40, indicating a slightly oversold condition but not yet reaching extreme levels.
- Stochastic Oscillator: Both %K and %D have been in the oversold territory, suggesting a potential reversal or bounce in the stock price.
- Williams %R: The Williams %R has been in the oversold region, signaling a possible buying opportunity.
Volatility Analysis:
- Bollinger Bands: The Bollinger Bands have been narrowing, indicating decreasing volatility and a potential period of consolidation.
- Bollinger %B: The %B indicator has been below 1, suggesting the stock price is trading below the lower band, potentially indicating an oversold condition.
Volume Analysis:
- On-Balance Volume (OBV): The OBV has shown mixed signals, with fluctuations in volume accumulation/distribution.
- Chaikin Money Flow (CMF): The CMF has been negative, indicating selling pressure in the stock.
Key Observations and Opinions:
- Trend: The stock is currently in a downtrend based on the EMA and MACD indicators.
- Momentum: The momentum indicators suggest a potential reversal or bounce in the stock price due to oversold conditions.
- Volatility: Decreasing volatility and narrowing Bollinger Bands indicate a period of consolidation.
- Volume: Mixed volume signals with a negative CMF suggest uncertainty in market sentiment.
Conclusion:
Based on the analysis of the technical indicators, the next few days' possible stock price movement for BRLS is likely to see a consolidation phase with a potential for a bullish reversal. Traders should closely monitor the momentum indicators for signs of a trend reversal and pay attention to volume patterns for confirmation. It is essential to exercise caution and wait for clear signals before making any trading decisions.