Technical Analysis of BREA 2024-05-10
Overview:
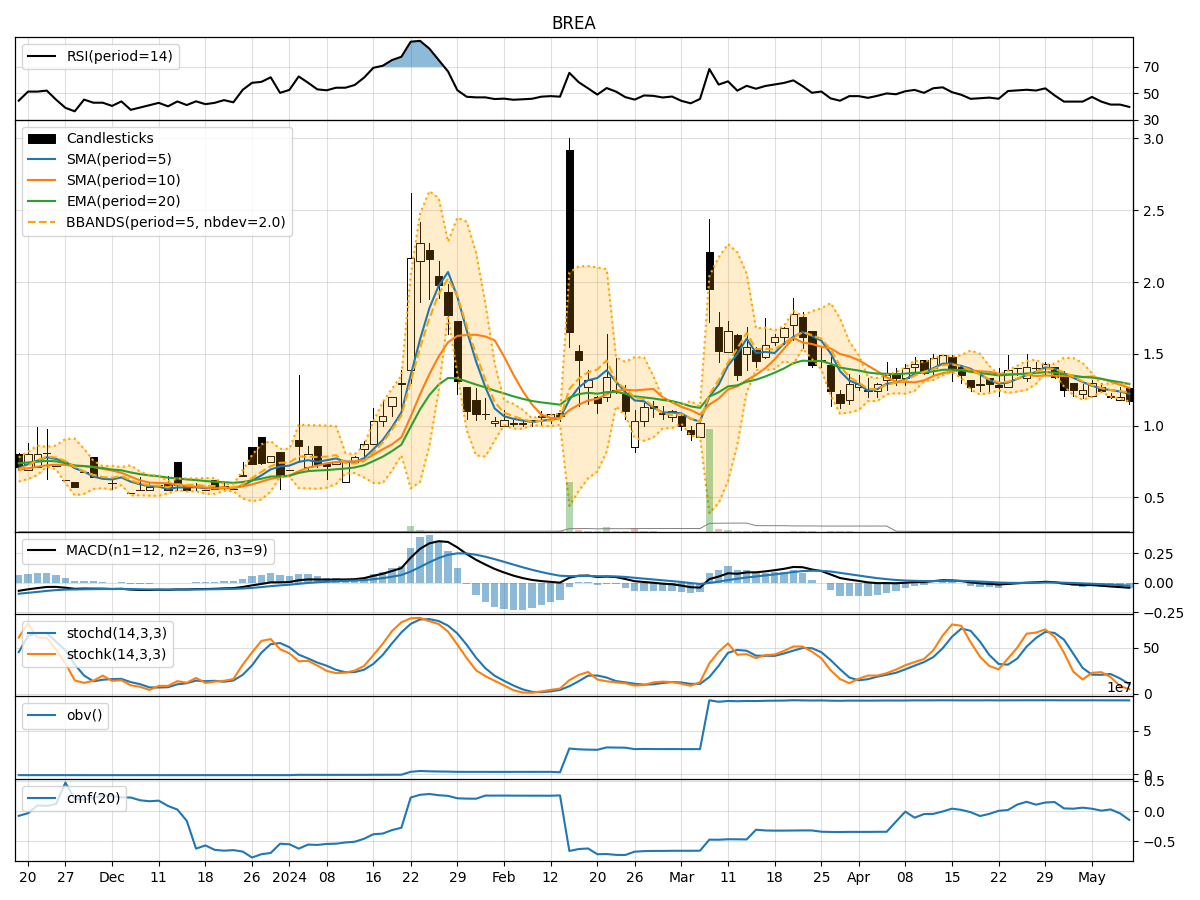
In analyzing the technical indicators for BREA stock over the last 5 days, we will delve into the trend, momentum, volatility, and volume indicators to provide a comprehensive outlook on the possible future stock price movement. By examining these key indicators, we aim to offer valuable insights and predictions for the upcoming trading days.
Trend Analysis:
- Moving Averages (MA): The 5-day MA has been consistently decreasing, indicating a downward trend in the stock price.
- MACD: The MACD line has been negative and decreasing, suggesting bearish momentum in the stock.
- EMA: The EMA has also been declining, further supporting the bearish trend in the stock.
Key Observation: The trend indicators all point towards a downward trajectory in the stock price.
Momentum Analysis:
- RSI: The RSI has been decreasing but is still above the oversold threshold, indicating weakening momentum.
- Stochastic Oscillator: Both %K and %D have been decreasing, signaling a loss in momentum.
- Williams %R: The indicator has been in the oversold territory, suggesting a potential reversal.
Key Observation: Momentum indicators reflect a weakening trend in the stock price.
Volatility Analysis:
- Bollinger Bands: The bands have been narrowing, indicating decreasing volatility in the stock.
- Bollinger %B: The %B has been decreasing, showing a compression in price movement.
- Average True Range (ATR): ATR has been decreasing, signifying lower volatility.
Key Observation: Volatility indicators suggest a reduction in price fluctuations.
Volume Analysis:
- On-Balance Volume (OBV): The OBV has been relatively stable, indicating a balance between buying and selling pressure.
- Chaikin Money Flow (CMF): The CMF has been fluctuating around the zero line, suggesting neutral money flow.
Key Observation: Volume indicators show a neutral stance in terms of buying and selling pressure.
Conclusion:
Based on the analysis of trend, momentum, volatility, and volume indicators, the overall outlook for BREA stock in the next few days appears to be bearish. The trend is downward, momentum is weakening, volatility is decreasing, and volume is relatively neutral. Therefore, it is likely that the stock price will continue its downward movement in the upcoming trading sessions.
Key Conclusion: The stock is expected to experience further decline in the next few days. Traders and investors should exercise caution and consider potential shorting opportunities based on the bearish technical signals.