Technical Analysis of BRAG 2024-05-10
Overview:
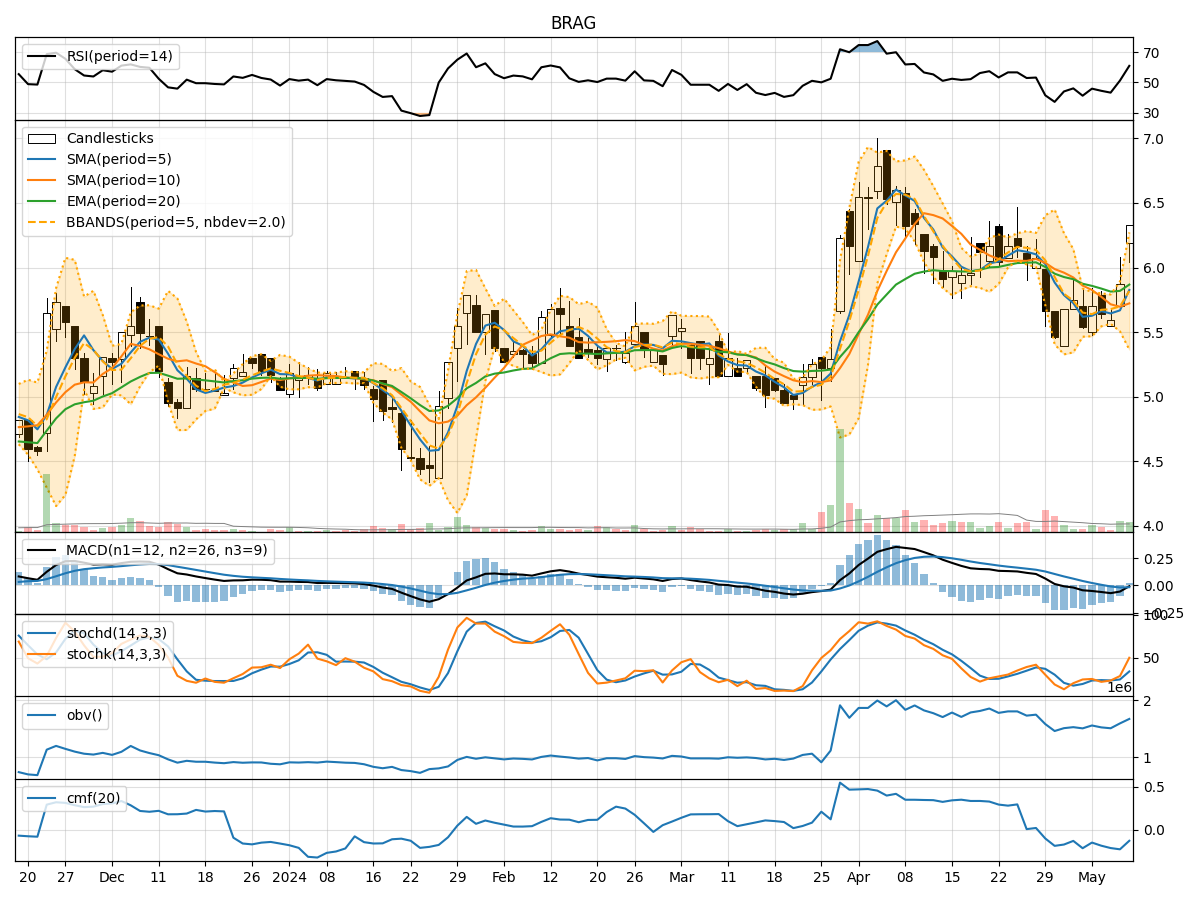
In analyzing the technical indicators for BRAG over the last 5 days, we will delve into the trend, momentum, volatility, and volume indicators to provide a comprehensive outlook on the possible stock price movement. By examining these key aspects, we aim to offer valuable insights and predictions for the upcoming trading days.
Trend Analysis:
- Moving Averages (MA): The 5-day Moving Average (MA) has been fluctuating around the closing prices, indicating short-term price trends. The Simple Moving Average (SMA) and Exponential Moving Average (EMA) show a downward trend, suggesting a bearish sentiment in the short to medium term.
- Moving Average Convergence Divergence (MACD): The MACD line has been negative, with the MACD Histogram also in the negative territory. This indicates a bearish momentum in the stock price.
Momentum Analysis:
- Relative Strength Index (RSI): The RSI has been below 50, indicating a bearish momentum in the stock. However, the RSI has shown some improvement in the last trading day.
- Stochastic Oscillator: The Stochastic indicators have been in oversold territory, but the %K and %D lines have started to move upwards, suggesting a potential reversal in momentum.
- Williams %R (Willams %R): The Williams %R has been in oversold territory, indicating a bearish sentiment. However, the recent uptrend in the indicator suggests a possible reversal.
Volatility Analysis:
- Bollinger Bands (BB): The Bollinger Bands have been narrowing, indicating decreasing volatility in the stock price. The recent price breakout above the upper Bollinger Band suggests a potential bullish momentum.
- Bollinger %B (BB %B): The %B indicator has been above 0.8, indicating an overbought condition. However, the recent price movement suggests a potential continuation of the uptrend.
Volume Analysis:
- On-Balance Volume (OBV): The OBV has been fluctuating, indicating indecision among investors. The recent increase in OBV suggests some accumulation in the stock.
- Chaikin Money Flow (CMF): The CMF has been negative, indicating selling pressure. However, the recent uptick in CMF suggests a potential reversal in buying pressure.
Conclusion:
Based on the analysis of the technical indicators, the stock of BRAG is likely to experience a short-term bullish momentum in the upcoming trading days. The improving momentum indicators such as the Stochastic Oscillator and Williams %R, coupled with the breakout above the upper Bollinger Band, suggest a potential uptrend in the stock price. Investors may consider buying opportunities in BRAG for potential short-term gains. However, it is essential to monitor the indicators closely for any signs of reversal or consolidation in the stock price movement.