Technical Analysis of BOSC 2024-05-10
Overview:
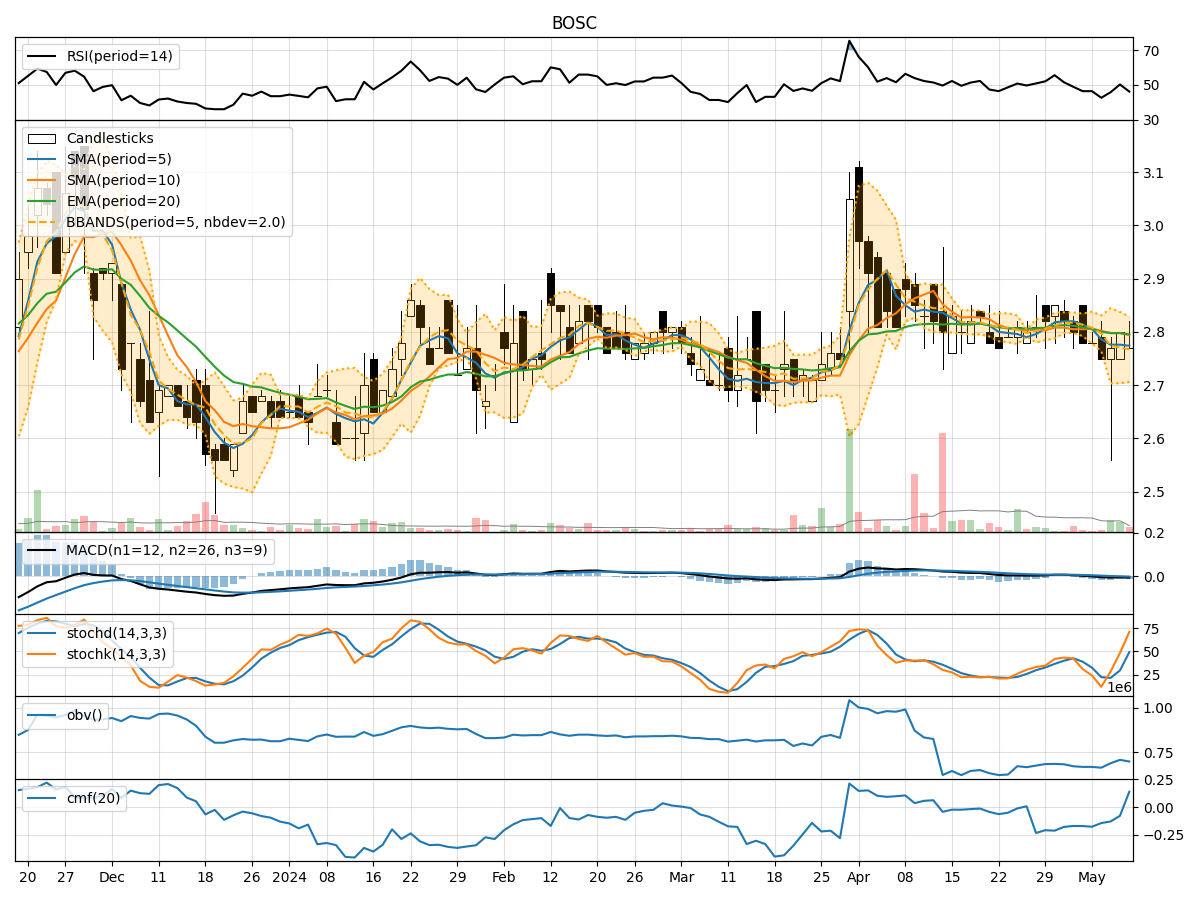
In analyzing the technical indicators for BOSC over the last 5 days, we will delve into the trend, momentum, volatility, and volume indicators to provide a comprehensive outlook on the possible stock price movement in the coming days.
Trend Analysis:
- Moving Averages (MA): The 5-day MA is slightly below the closing prices, indicating a short-term downtrend.
- MACD: The MACD line is below the signal line, suggesting a bearish momentum.
- EMA: The EMA is trending slightly downwards, reflecting a weakening trend.
Momentum Analysis:
- RSI: The RSI is hovering around 50, indicating a neutral momentum.
- Stochastic Oscillator: The Stochastic indicators are mixed, with the %K above the %D, suggesting a potential reversal.
- Williams %R: The Williams %R is close to oversold levels, signaling a possible buying opportunity.
Volatility Analysis:
- Bollinger Bands (BB): The stock price is within the bands, indicating normal volatility.
- BB Width: The bands are narrowing, suggesting a potential decrease in volatility.
Volume Analysis:
- On-Balance Volume (OBV): The OBV is showing a slight decrease, indicating some selling pressure.
- Chaikin Money Flow (CMF): The CMF is negative, signaling a bearish money flow.
Key Observations:
- The trend indicators suggest a short-term downtrend.
- Momentum indicators show a neutral stance with a potential for a reversal.
- Volatility is normal but may decrease in the near term.
- Volume indicators indicate some selling pressure.
Conclusion:
Based on the analysis of the technical indicators, the next few days' possible stock price movement for BOSC is likely to continue in a downward direction with a potential for a reversal in momentum. Traders should exercise caution and consider waiting for a clearer signal before making any significant trading decisions.