Technical Analysis of BKR 2024-05-10
Overview:
In analyzing the technical indicators for BKR over the last 5 days, we will delve into the trend, momentum, volatility, and volume indicators to provide a comprehensive assessment of the stock's potential price movement. By examining these key factors, we aim to offer valuable insights and predictions for the next few days.
Trend Analysis:
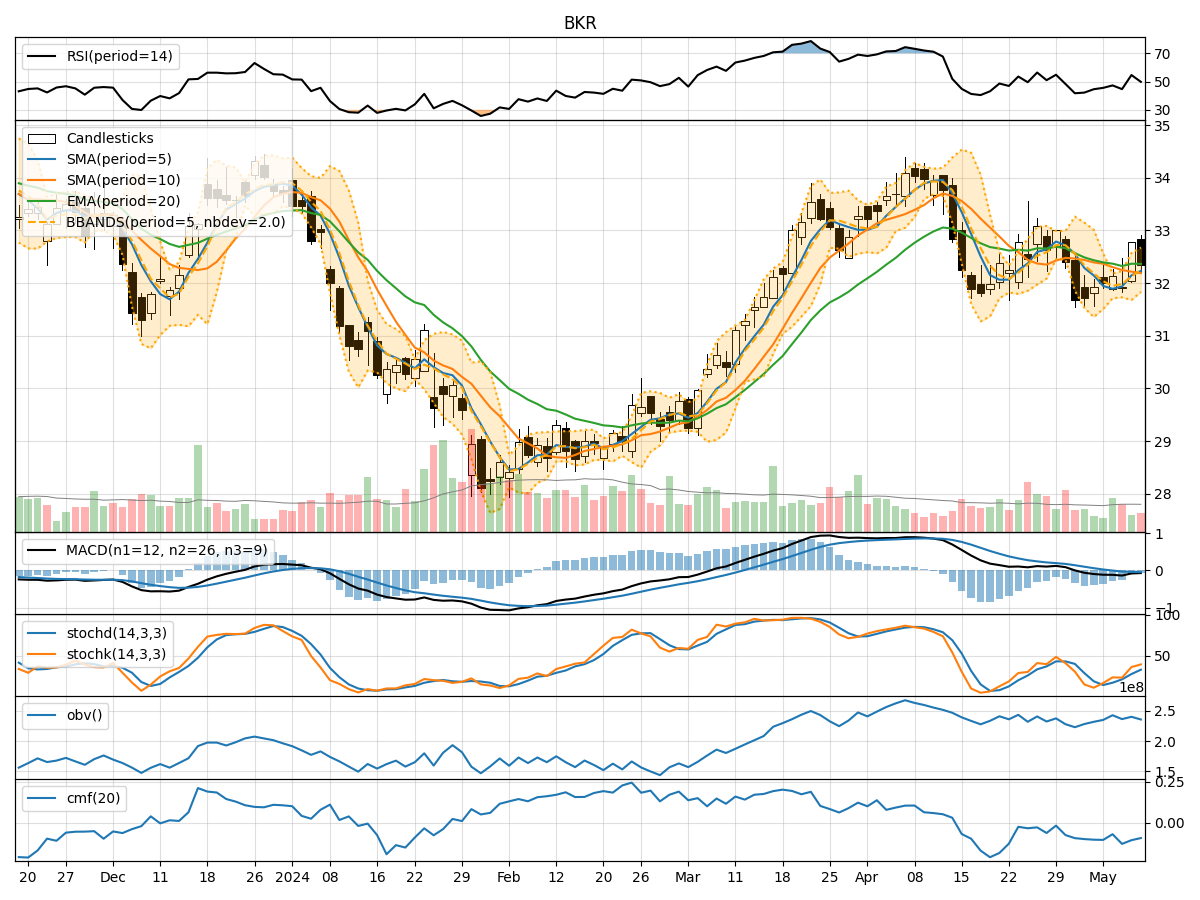
- Moving Averages (MA): The 5-day MA has been fluctuating around the closing prices, indicating a lack of clear trend direction.
- MACD: The MACD line has been consistently below the signal line, suggesting a bearish momentum in the short term.
- EMA: The EMA has been declining slightly, reflecting a weakening trend.
Momentum Analysis:
- RSI: The RSI has been hovering around the mid-range, indicating a neutral momentum.
- Stochastic Oscillator: Both %K and %D have been showing mixed signals, with %K crossing above %D recently.
- Williams %R: The indicator has been fluctuating in the oversold and neutral zones, signaling indecision in momentum.
Volatility Analysis:
- Bollinger Bands (BB): The bands have been narrowing, suggesting decreasing volatility.
- BB %B: The %B indicator has been hovering around 0.5, indicating a balanced market sentiment.
Volume Analysis:
- On-Balance Volume (OBV): The OBV has been relatively stable, showing no significant divergence.
- Chaikin Money Flow (CMF): The CMF has been negative, indicating selling pressure in the market.
Key Observations:
- The trend indicators suggest a lack of clear direction, with a slightly bearish bias.
- Momentum indicators show a neutral stance with no strong bullish or bearish signals.
- Volatility has been decreasing, indicating a potential period of consolidation.
- Volume indicators reflect a balanced market sentiment with no significant accumulation or distribution.
Conclusion:
Based on the analysis of the technical indicators, the next few days for BKR are likely to see sideways movement with a slight bearish bias. Traders may expect the stock price to consolidate within a narrow range as volatility remains low. It is advisable to closely monitor key support and resistance levels for potential breakout opportunities.